Main Page/BPHS 4090/Choloplast Translocation
Contents
Required Components
- Stock culture of Eremosphaera viridis
- Glass slides, cover slips and micropipette
- Nikon Optiphot Microscope
- Radiometric Probe (Model S471 Portable Optometer, UDT Instruments)
- Cool Snap CCD Camera and MicroManager software
- Blue and red band-pass filters
Objective
To observe the wavelength dependence of light on chloroplast translocation in the acidophile green algae Eremosphaera viridis as well as describing a mechanism behind this response.
Introduction
Electromagnetic radiation is the driving force for photosynthesis. Plants and other autotrophs convert the energy of light into chemical energy used for synthesizing carbohydrates and other organic compounds, which heterotrophic organisms use for energy and other nutritional requirements. Photosynthesis is a unique process performed by plants, algae, and some species of bacteria. It consists of a series of oxidation and reduction reactions; the basic chemical formula is shown below:
|
|
Photosynthesis would not be possible without the energy derived from light. Electromagnetic radiation enters the earth’s atmosphere from the sun where it is harvested by photosynthetic organisms. Wavelengths between 400 and 800 nm are used by photosynthetic organisms. The sun can be approximated as a near perfect blackbody with a surface temperature of 5800 K described by Planck’s Black Body Radiation Law, shown in Equation 1.1

|
Where U (λ, T) has units of J m-2 s-1, h is Planck’s constant, K is Boltzmann’s Constant and c is the speed of light. The color temperature of the sun corresponds to a peak wavelength emission of about 500nm according to Wien’s Displacement Law (Equation 1.2)

|
Where b = 2.898 x 10⁻³ in units of m*K.
The first step in the conversion of the energy of photons to chemical energy is absorption by photosynthetic pigments, principally chlorophyll. The absorption spectrum of chlorophyll a is shown in Figure 1 [1].
 Absorption Spectrum of Chlorophyll a: Chlorophyll a strongly absorbs
light at 465nm and 665nm. There is minimal
absorption of UV light as well as green/yellow light
which appears in the range of 500nm-600nm. These
absorbances are for chloroplasts isolated in a
solvent of a well-defined dielectric. In the cell,
additional pigments and heterogeneous dielectric
causes much broader peaks.
|
Chlorophyll is located inside the thylakoid vesicles in the inner membrane of the chloroplast. After absorbing a photon, an electron in chlorophyll transitions to an excited state. The excited state electron (exciton) is transferred to a photosynthetic reaction center to begin the flow of electrons through the electron transport chain, eventually to produce ATP (from a transmembrane H+ gradient) and reducing equivalents (NADP + 2e– + 2H+ —> NADPH + H+). Chlorophyll, now with one less electron, is chemically unstable and receives an electron from a water molecule (H2O). With the loss of 4 electrons from two molecules of water, molecular oxygen (O2) is produced, as well as 4H+ used for ATP synthesis. Oxygen, the waste product of photosynthesis, is vital for heterotrophs in the process of cellular respiration.
As light intensity increases, so do absorption events and the generation of excited state chlorophylls, and downstream electron transport. At a high enough light intensity, these can cause the formation of a variety of undesirable oxidative products that can damage the photosynthetic apparatus. Examples include triplet state chlorophyll, and various reactive oxygen species (through direct reduction of O2 to O2–, and subsequent formation of H2O2). The general term photo-oxidation is used to describe this damaging process. There are protective mechanisms to avoid oxidative damage [2]; one of these may be to decrease the absorptive cross-sectional area of chloroplasts by changing their location in the cell [3]. The phenomenon known as systrophe is described as the accumulation of cytoplasmic organelles around the nucleus [4][5][6]. Systrophe of the chloroplasts is observed in the unicellular green algae Eremosphaera viridis when the cell is exposed to intensities of light greater than it would experience in its natural environment.
During this experiment we will be examining chloroplast translocation in the unicellular green algae Eremosphaera viridis, in particular we will be looking at the wavelength dependence of light on systrophe. A typical cell of E. viridis is shown in Figure 2 during the course of a light treatment protocol.
 Figure 2: Examples of incipient and Complete Systrophe in Eremosphaera
viridis This particular cell was illuminated with a photon flux of 200 μmol m-2 s-1 using a blue bandpass filter with a peak wavelength of 441nm ± 10nm.
|
From Figure 2, it can be seen that the systrophe effect is quite dramatic! At 0 minutes is how the cell would appear in its resting state, at 20 minutes into the light treatment protocol there are signs of chloroplast translocation, this cell would be classified as incipient systrophe since it is in the process of undergoing systrophe. Lastly at 60 minutes into the light treatment the cell would be classified as complete systrophe. Notice at 60 minutes the cytoplasmic strands which chloroplasts migrate along during light treatments are clearly visible!
An Eremosphaera viridis cell has about 400 chloroplasts, based on counting of medial sections of fluorescence images. In a normal chloroplast, there is about 9•10–13 g of chlorophyll and about 6.7 • 108 chlorophyll molecules per chloroplast. The molecular weight of chlorophyll a is about 894; its extinction coefficient is 1.2 • 105 M–1 cm–1 at 430nm [7].
Materials and Methods
The procedure is divided into four sections:
- Preparing a sample slide
- Microscope Set-Up and Kohler Illumination
- Light Treatments
- Image Processing
Please follow them in order; each section has its own set of step by step instructions.
Preparing a Sample Slide
- Take a new glass slide and trace the outline of the cover slip using a permanent black marker as shown in Figure 3A.
- Spread a thin layer of Vaseline as shown in Figure 3C & D along the outline you just traced using the syringe (Figure 3B), this will prevent your cell sample from drying out under high light tensities
- Aliquot 10μL of E. viridis in the outline you just traced using a micropipette as shown in Figure 3E
- Gently place the cover slip on top of the Vaseline layer, being careful not to crush your cell sample
- Now the slide is ready to be used for light treatments (Figure 3F).
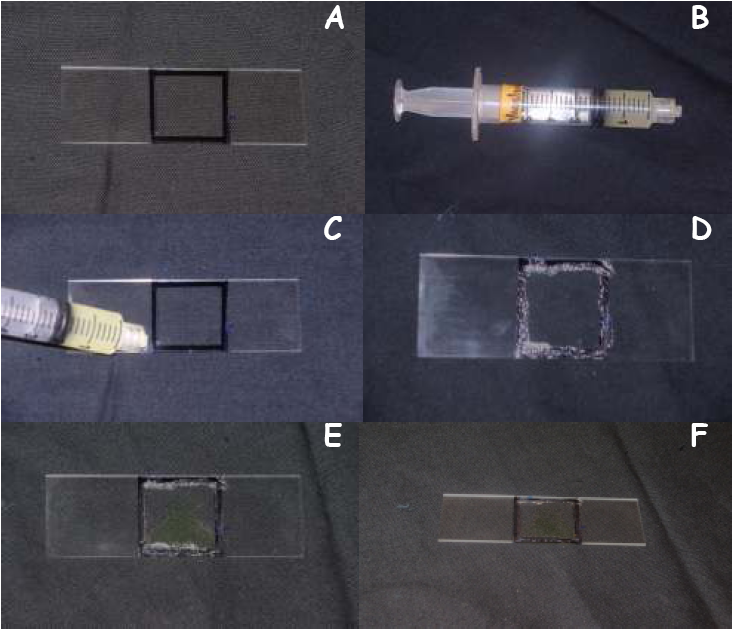
Figure 3
Microscope Set-up and Kohler Illumination:
References
- ↑ http://www.bio.davidson.edu/courses/Bio111/Bio111LabMan/lab1fig3.gif
- ↑ Li, Z., Wakao, S., Fischer, B.B., Niyogi, K.K. 2009. Sensing and responding to excess light. Annual Review of Plant Biology 60: 239–260.
- ↑ Kasahara M., Kagawa, T., Oikawa, K., Suetsugu, N., Miyao, M., Wada, M. 2002. Chloroplast avoidance movement reduces photodamage in plants. Nature 420: 829–832
- ↑ Weidinger, M. 1980. The inhibition of systrophe by cytochalasin B. Protoplasma 102: 167–170.
- ↑ Weidinger, M. 1982. The inhibition of systrophe in different organisms. Protoplasma 110: 71– 74.
- ↑ Weidinger, M., Ruppel, H.G. 1985. Ca2+ requirement for a blue-light-induced chloroplast translocation in Eremosphaera viridis. Protoplasma 124: 184–187.
- ↑ Lawlor, D.W. 2001. Photosynthesis. Third edition. Springer-Verlag, New York. Chapters 3 and 4.
