Main Page/BPHS 4090/Mapping a binding site using NMR spectroscopy
In this experiment, you will be using studying a fragment of a protein called CASKIN. It is involved in neuronal signaling. When a neuron is stimulated, chemical messengers are transferred between two neurons at a specialized cell-cell junction called a synapse. CASKIN is a scaffolding molecule found at the pre-synaptic side of the connection. A scaffolding molecule, much like its name, helps assemble other protein together in a certain part of the cell.
- In the box below, draw a schematic of a synapse and the approximate location where CASKIN.
|
|
CASKIN is composed of many protein domains, each with its own function. Not suprisingly, since CASKIN’s job in the cell is to bring together other proteins, it is composed exclusively of domains that promote protein-protein interactions.
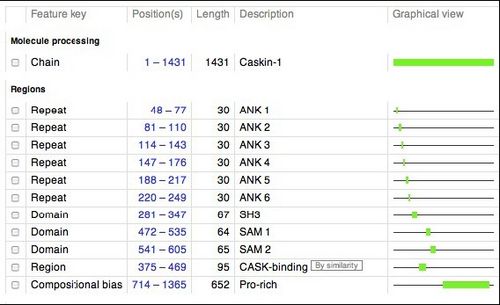
Below is a schematic of human CASKIN (1365 amino acids). This schematic was retrieved from the UNIPROT website (http://www.uniprot.org/uniprot/Q8WXD9), a respository of information on thousands of proteins. We will be studying the SH3 domain of CASKIN, found between amino acids 281 and 347 in the protein.
Members of the Donaldson laboratory used a technique called PCR to amplify the gene fragments encoding the SH3 domain, the first SAM domain, the second SAM domain, and the two SAM domains together. These fragments were inserted in to an expression vector, a circular piece of DNA or plasmid, that can be introduced into the common laboratory bacterium, Escherichia coli. Upon addition of a special kind of sugar into the culture which the bacteria cannot metabolize, the bacteria will begin to produce the human protein that we have programmed into them.
The cells were harvested and then cracked open. From the thousands of proteins in the bacterium the CASKIN SH3 domain was purfied in about two hours because it was tagged with a special sequence of six histidines that no other native bacterial protein had. Six histidines bind nickel very well so we used a special type of chromatography when nickel ions are exposed on a resin.
The protein was further purified by a technique called gel filtration that separated molecules according to their size. At this point the protein was extremely pure. It was then concentrated to about 10 mg /mL which doesn’t sound like much but it is !
- From the NMR laboratory tour that you participated in, fill in the vital statistics of the CASKIN SH3 domain NMR sample:
|
length of NMR tube | |
|
width of NMR tube | |
|
volume range of NMR sample (mL) | |
|
ideal concentration of a protein [mM] | |
|
temperature range of experiments | |
|
temperature of the magnet (K) | |
|
field strength of the magnet (Tesla) | |
|
precession frequency of a 1H nucleus | |
|
precession frequency of a 15N nucleus |
The protein that was used to acquire the NMR data was uniformly isotropically labeled with 15N. To achieve this, the bacteria were grown in a medium containing 15N-ammonium chloride as their only source of nitrogen.
- Why is 15N useful for NMR spectroscopy and not 14N, the natural abundance isotope ?
|
|
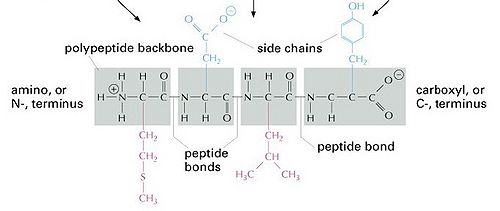
One of the first NMR experiments that is acquired on a protein sample is called a 2D 15N-edited HSQC. This experiment consists of a pulse sequence that selects only for 1H bound by one bond to a 15N. All other bonds such as 1H-12C and 1H-13C are not observed. An HSQC experiment is an extremely useful tool to gain and immediate understanding of the protein structure, it’s like a fingerprint of sorts. Here is the basic chemical formula of a protein. As you can see, there is an amide NH in the protein backbone. Thus, you would expect to see one NH resonance (or spot/peak) per amino acid. The CASKIN SH3 domain that we will be studying has the following sequence:
The quaternary amino group (NH3+) at the beginning of a protein is not visible by NMR methods. The 1H exchange with protons from water very quickly.
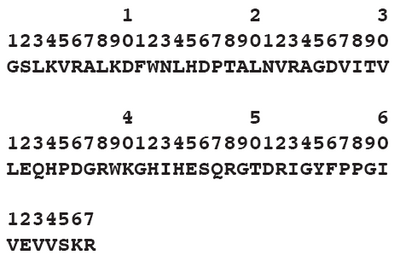
Some amino acids have NH in their side chains and other amino acids do not have any NH at all. Here is the sequence of the CASKIN SH3 domain exactly how it was made for the NMR experiments.
|
|
- Consulting a table of amino acids, how many NH resonances would you expect to see in a 2D spectrum of the CASKIN SH3 domain ?
|
|
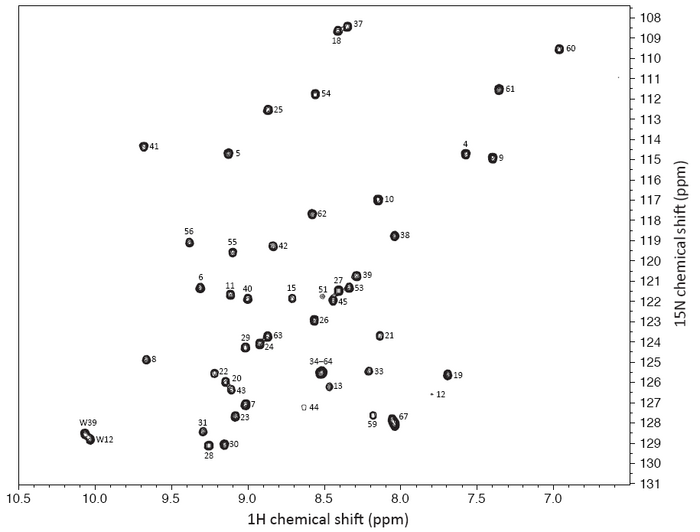
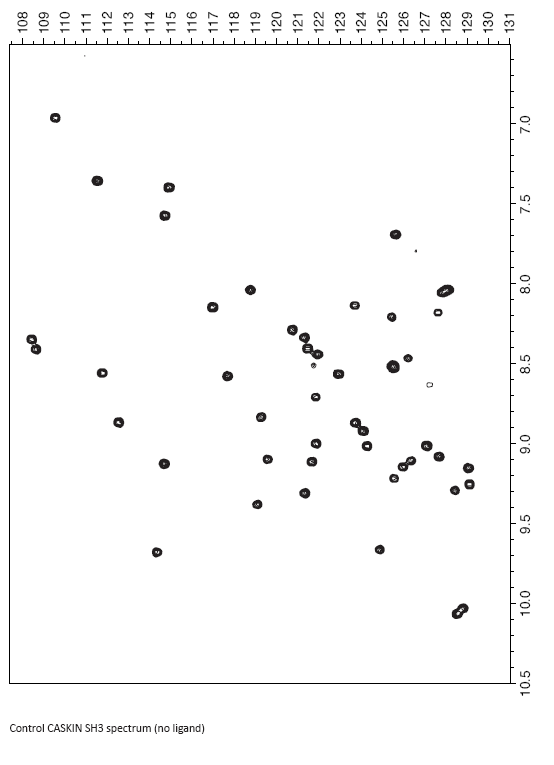
Here is an HSQC spectrum of the CASKIN SH3 domain. The number of resonances is probably lower than what you expected from your calculation. This is a portion of a large NMR spectrum in the chemical shift range that you would expect to find 1H and 15N in a protein. The center of the true NMR spectrum is 4.7 ppm (though all amide NH are found downfield, or at larger values than that). The center of the true NMR spectrum is 120 ppm for 15N or exactly what is shown there.
Using a series of 3D NMR experiments, I assigned (or identified) the specific amino acid in the SH3 domain that contributed a given resonance. This procedure required about one week of data collection from the NMR spectrometer and about four hours of manual inspection. There are computer programs available now that can assign the spectrum in a matter of minutes, but the dataset has to be excellent (high signal-to-noise, no artifacts). For many proteins, that is not possible, although the programs are getting better with handling imperfect datasets.
|
|
A special filtering technique was used to remove all of the NH2 amino groups from the spectrum so there are only NH’s visible. Note that all of the peaks are spread out. Inituitively, you might think that the spectrum might be a big blob of peaks in the middle since they are, in essence, all NHs and chemically the same. That’s true, but in a protein, each amide NH belongs to a different amino acid which creates some electronic differences which are then manifested as magnetic differences. The biggest contributing factor, though, is that the protein is structured. And when an NH participates in an hydrogen bonds (in an alpha helix or beta sheet) or is near an aromatic group (due to the configuration of their electrons, they are like little magnets themselves), their local environment becomes different. For some small chemical compounds, there are programs that can predict very well where a certain 1H resonance should be found. However, these computing methods rely on quantum mechanics principles and the number of atoms to deal with in a proteins makes the solution impossible to calculate.
The great thing about chemical shifts is that they are very sensitive. Changes the chemical enviroment (and structure) of the protein will be observed as changes in chemical shift. For example,
- pH
- temperature
- salt concentration
- protein modifications such as phosphorylation
will all change the chemical shifts of a protein.
Chemists studying an enzymes mechanism like to perform chemical shift perturbation Amino acid sidechains that are ionizable in the active site (such as Asp, Glu, His, Arg, Lys) and catalytically important will often display different individual pK’s that are distinct from non-catalytic side chains.
Pharmaceutical researchers use chemical shifts in a method SAR-by-NMR (Structure Activity Relationship by NMR). Instead of altering chemical conditions, they add a drug to the solution. If the drug binds somewhere on the protein, the chemical shifts in the vicinity of the drug will generally changes as the protein changes its structure to bind the drug. If the chemists know the identity of the changes, they can map those changes onto a structure of the protein and identify where the drug is binding. So more clever approaches involve binding a different drug somewhere nearby and then tethering the two identified drug neighbours into a more potent superdrug that is more than the sum of its parts.
SH3 domains are well known for their ability to bind short 7-9 amino acid long peptides that tend to be rich in proline. Take a look at Dr. Tony Pawson’s excellent website to learn more:
http://pawsonlab.mshri.on.ca/index.php?option=com_content&task=view&id=179&Itemid=64
|
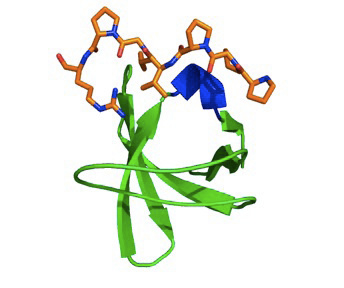
Here is an SH3 domain in ribbon format that shows its series of beta strands coloured
green. A peptide in orange binds a set of grooves in the surface of the protein. The peptide is special in that it adopts an left-handed helix. Generally, only proline-rich sequences can form a left-handed over the more common right handed helix
|
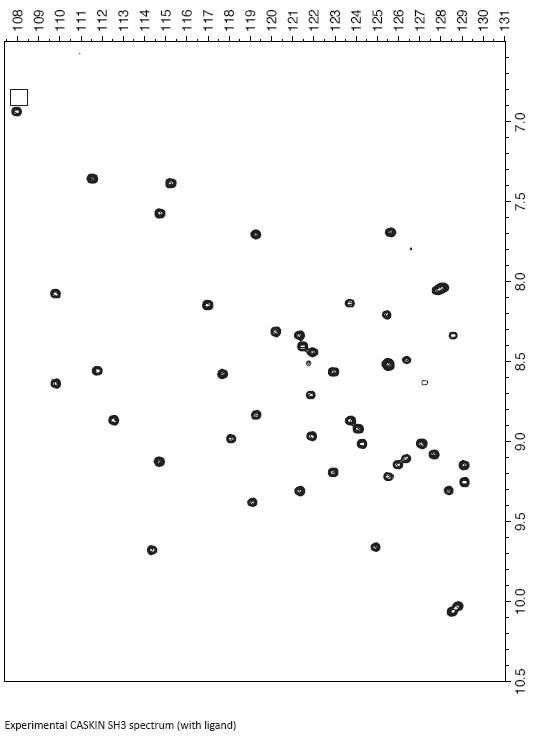
Your next objective is to interpret some binding data on the following pages. To the CASKIN SH3 domain, I added a hypothetical ligand for it. As a result some of the amide chemical shifts changed. You first task is to compare the control spectrum (free SH3 domain) and the experiment spectrum (SH3 domain plus ligand) and identify the changes and their magnitude.
Although I would do it by computer, you can do it by overlaying the two spectra and first identifying the major movers. You can get the magnitude of the changes simply by using a ruler and measuring the distance. A distance in mm doesn’t need to be converted back into ppm because you are just scaling by a constant value anyways.
- List the amides that moved the most below, along with the magnitude of the change:
|
|
- Analyse the labeled reference spectrum provided on the earlier pages. Which amide resonances are missing ? Notice that some peaks are weaker than others. It turns out that sites on the protein that are experience additional dynamics in the range of miili- to microseconds tend to have peaks broadened out. The volume is the same - it’s just the peak is really wide. List the missing and weak resonances below:
|
|
|
|
|
|
Now that you have your chemical shift perturbation data, you can map it onto the surface of the CASKIN SH3 domain structure. Download the structure as a pyMOL session file from
http://farq047c.biol.yorku.ca/biophysics/caskinsh3.pse
Download the pyMOL molecular graphics program from
Mac:
http://www.pymol.org/rel/099/macpymol-0_99rc6.tar.gz
Windows:
http://www.pymol.org/rel/099/pymol-0_99rc6-bin-win32.zip
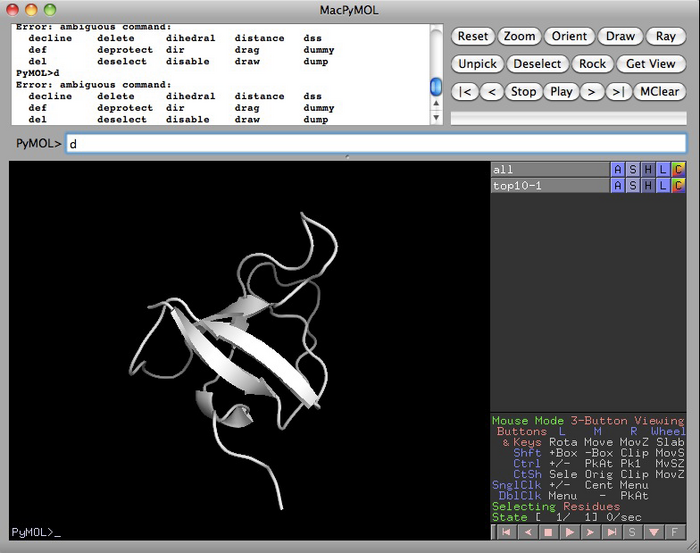
If everything worked with pyMOL and the file, you should have a screen like the one below:
|
|
You can make your biggest movers, slight movers and weak peaks by making selections in the scripting language of the program. For example, to make a selection of amino acids 19, 35 and 52, I could creating a special “object” called “an-example” by typing according to the syntax below. Try it for your various movers and such:
|
|
You can colour and annotate using the buttons to the right of the selection. “S” is for Show. “H” is for Hide. “L” is for Label and “C” is for colour.
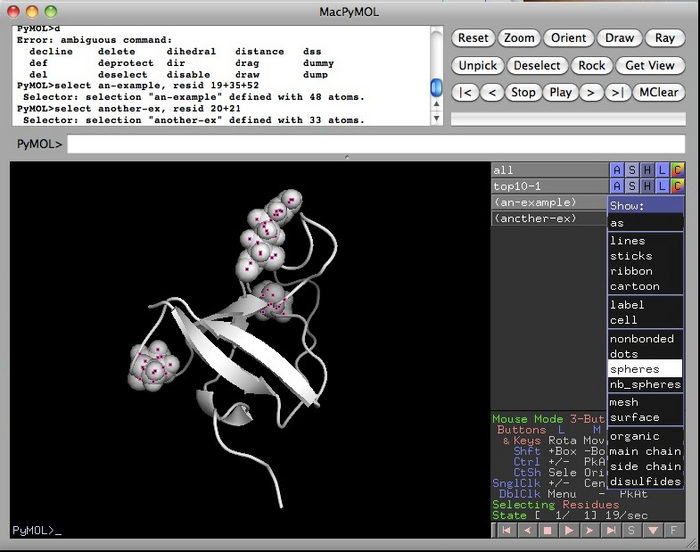
Here I’ve clicked on the “S” and “spheres” selections in the “an-example” entry to highlight those amino acids in space filling format.
|
|
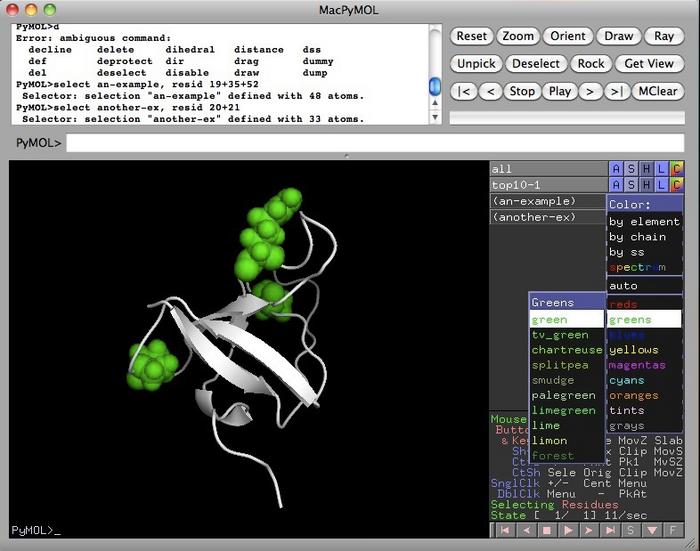
Using the “C” button, you can choose a colour for them. I chose green.
|
|
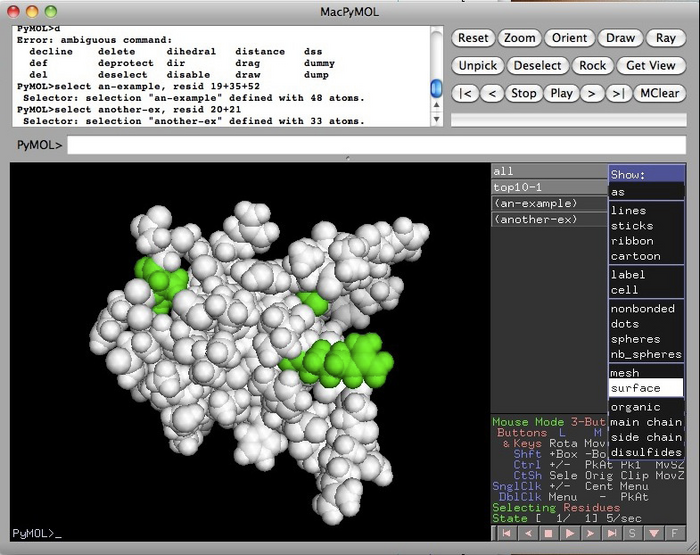
In this next example, I went to the “S” button in “top10-1”, that’s the name of the original molecule, and selected “spheres”. Now I can see where the highlighted amino acids are on the surface.
You can save what you are doing at any time by going to the main menu under File and choosing “save session as”
|
|
This is part where you are now on your own ! With your data and pyMOL, figure out where the binding surface is on the molecule. Also where are missing amino acids located ? At the loops, at the ends of the molecule ? Somewhere else?
You can save a nice picture by taking a screen-shot or by using the “png” command.
|
|
Consult the comprehensive “pyMOL wiki” for more commands and tips
http://www.pymolwiki.org/index.php/Main_Page
Attach your output to the end of this laboratory report along with any additional information and insights. Good luck !
