Main Page/BPHS 4090/microscopy II
Contents
Required Components
- Stage micrometer slide
- Chroma fluorescent slide kit
- Fluorescent bead slide
- Fluorescent microchannel slide
- Fresh onion
- Knife and tweezers
- Toothpick or popsicle sticks
- Blank slides and coverslips
- Syringe of vaseline with pipette tip end
- Distilled water
- Immersion oil
- Nikon upright microscope and CCD camera
- Usb stick for transferring data and images for processing and report generation
Objectives
In this lab students will expand their use of optical microscopes to include fluorescence imaging, which allows for highly specific labelling of proteins and complexes within the specimen. Fluorescence is often complimented with Differential Interference Contrast imaging (DIC), and this will also be explored during these experiments. Fluorescence really is a quantum mechanical phenomenon, and the emphasis here will be on understanding what is physically happening within samples that are fluorescently labelled. Understanding the principle of fluorescence filtering and getting a feel for the light intensity levels being generated is critical for fluorescence microscopy.
Introduction
Fluorescence microscopy is a very powerful tool allowing for the observation and quantification of biological samples. You have seen previous labs how unstained samples contain very little contrast, and through the addition of light absorbing dyes and stains or special optics, the morphology and structure of samples can be readily observed. Fluorescence microscopy uses the same concept of imparting artificial contrast to samples, but has several advantages over absorption based contrast methods. In this contrast method, fluorescent molecules are attached to specific structures within the specimen. Illuminating the specimen with a specific wavelength of light causes these fluorescent molecules to convert some of this illumination into a longer wavelength of light, which is then detected by a CCD or observed directly with the eye.
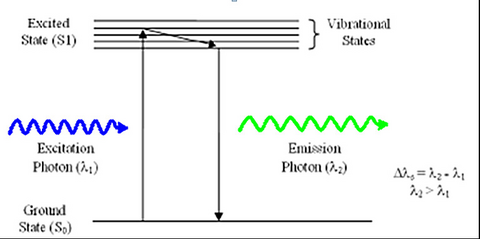
Fluorescence is a phenomenon first discovered by British scientist Sir George Stokes in 1852. The process involves the absorption of an incident photon of light by a molecule, referred to as a fluorophore, and subsequent emission of a second fluorescent photon a short time later (Figure 1). The energy transferred to the fluorophore after absorption causes the molecule to enter an excited energy state that is short-lived, typically on the order of 10-9 seconds (1/e value). During this time, some of the incident energy is lost due to vibrational/rotational motion and heat, among other things. When the molecule returns to the ground state, a fluorescence photon is emitted at a longer wavelength (lower energy). This fluorescence can be detected with a colour filter that passes the fluorescence emission and blocks the shorter wavelength excitation light. The difference in wavelength between the incident and outgoing photons is referred to as the Stoke’s Shift, and its phenomenon is the basis for all fluorescence imaging as it allows us to use a colour filter set to separate the excitation and emission photons.
|
Figure 1 –Schematic representation of the process of fluorescence. Light absorbed by a molecule causes it to move
into an electronic excited state. After losing some energy to heat/vibration/rotation, a fluorescent photon is
emitted and the system returns to the ground state.
|
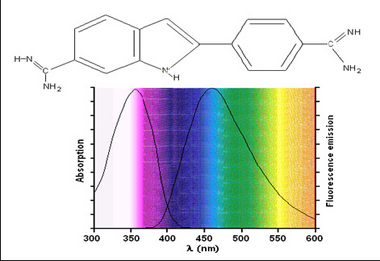
Fluorescent samples can be stained using two methods; dyes or antibody-based labels. Dyes such as 4’-6’-Diamidino-2-phenylindole (DAPI) or Hoescht are commonly used in fluorescence microscopy to stain nuclei. Both can be used on live or fixed cells, and are relatively inexpensive. Upon incubation with a sample, DAPI binds with A-T rich repeats of chromosomes in the DNA and the fluorescence emission efficiency increases versus its unbound state. This enables visualization of cell nuclei when excited in the ultra-violet (UV) wavelength range and produces blue fluorescent light. The chemical structure as well as absorption and emission spectrum from DAPI are shown in Figure 2.
|
Figure 2 –Chemical structure and excitation/emission spectra of DAPI when bound to DNA. DAPI is excited by UV
light and produces blue fluorescent light. Its emission spectrum is quite broad in contrast to other fluorophores.
|
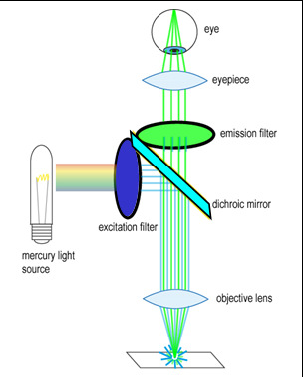
To generate and detect the light emitted by fluorescent molecules some modifications to the microscope light path are necessary (Figure 3). The excitation light is passed through an excitation filter, which reduces the light to a specific wavelength, and is reflected off a dichroic beamsplitter (DBS). A DBS is coated with a special surface designed to reflect light of one wavelength range and transmit a different wavelength range. In the example shown in the figure, the DBS will act as a mirror to blue light, and allow longer wavelength green light generated at the sample to pass through it. The light then passes through one additional filter (emission filter), which further separates any fluorescence from excitation light that may have passed through the DBS.
|
Figure 3 - Illumination path in an epi-fluorescence microscope. A filter cube contains an excitation filter, dichroic
beamsplitter, and emission filter and is responsible for separating the excitation light from the generated
fluorescence.
|
The excitation and emission filters as well as DBS are contained within what is called a filter cube, and these can be easily switched while working with the microscope to observe different fluorophores. The microscope you will be working on has space for two separate filter cubes operated on sliders. Other microscopes may use a wheel to translate the filters in and out of the optical path. In highly automated microscopes these filter changes can be motorized and controlled from the microscope software. The DBS directs light at the sample through epiillumination, which means that the objective lens is used to deliver light to the sample and collect the fluorescence emission. Recall that in transmitted light or brightfield imaging, a condenser is used to illuminate the sample from the opposite side of the sample. Using epiillumination to deliver excitation light through the sample allows for more efficient transfer of excitation light to the sample (always a critical concern in fluorescence) and reduces the amount of excitation light re-collected by the objective lens.
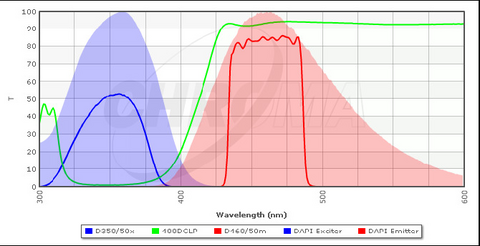
A typical configuration for a filter cube optimized for excitation and detection of DAPI is shown in Figure 4 along with the excitation/emission spectra of DAPI. The excitation filter (blue line) transmits light of a specific wavelength range which is efficient at exciting bound DAPI (blue solid area). The DBS (green line) is designed to transmit wavelengths above ~ 410 nm, and thus it will reflect almost all of the excitation light at the sample. The emission filter (red) is used to clean up the light that is collected by the objective and passed through the DBS, and it is optimized for detection of the emission peak of DAPI (red solid area). The emission filters used in your microscope are longpass filters, which are slightly different from the bandpass filter shown below. A longpass filter has a transmission spectrum similar to the tail of the DBS spectra and passes all wavelengths above a certain threshold. This allows for collection of more of the fluorescence signal which typically increases image quality, but prevents multiple fluorophores from being imaged simultaneously.
|
Figure 4 - Typical filter cube configuration for detection of DAPI in stained specimens. The bandpass emission filter
(red line) can also be swapped out for a longpass filter, similar in shape to the tail of the DBS spectrum (green line).
|
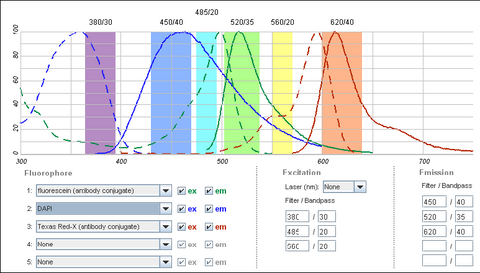
It is possible to use a single filter cube to visualize multiple fluorophores simultaneously, and while this is often done, it is generally better to acquire fluorescence images one channel at a time. A filter configuration for observation of a common set of fluorophores (DAPI/FITC/Texas Red) is shown below in Figure 5. Note that the absorption and emission maxima have been normalized in the plots below. The relative strength of fluorescence from fluorophores will vary from channel to channel, which will typically require adjustment of the excitation light intensity or CCD exposure time for different channels.
|
Figure 4 - Triple filter configuration for detection of fluorophores simultaneously. Bleedthrough of DAPI
fluorescence into the green FITC detection channel often requires images to be acquired individually. FITC and
Texas Red emissions are separated enough to be viewed simultaneously.
|
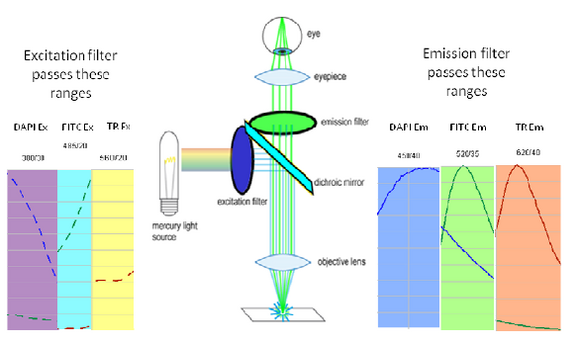
Shown in the figure are the excitation (dashed lines) and emission (solid lines) of DAPI (blue), FITC (green) and Texas Red (red). To attempt viewing these three fluorophores simultaneously a filter cube would have an excitation filter that passes light in the purple (365 – 395 nm), cyan (475 – 495 nm) and yellow (550 – 570 nm) wavelength regions. These bands are selected to match up with the absorption spectra of the three dyes to be excited. This excitation light would then reflect off of a broadband beamsplitter which reflects only 10-20% of the excitation light to the sample. This is done to maximize the transmission of fluorescence photons back through the filter cube as 80-90% of them will pass through the beamsplitter to be detected. To separate the fluorescence emissions from each other, the emission filter would only pass light in the blue (430 – 460 nm), green (503 – 538 nm) and red (600 – 640 nm) ranges. These ranges are selected to overlap with the fluorescence emissions, and avoid detection of any reflected excitation light collected by the objective lens. To help you visualize the light path a bit better refer to Figure 6 below.
|
Figure 6– Triple excitation and emission light path in a fluorescence microscope. The dichroic mirror in this instance is a broadband mirror with 10-20% reflection and 80-90% transmission to maximize fluorescence detection efficiency. The portions of the excitation and emission spectra from DAPI/FITC/Texas Red contained in the filter bandpasses are shown as dashed and solid lines, respectively.
|
On the excitation side we can see that the DAPI excitation actually causes some excitation of the FITC fluorophore. This can cause ghost images to appear if filtering is not properly performed. On the emission filter side we can see that there is no FITC emission in the DAPI detection channel (blue region), and thus the excitation of FITC by the DAPI excitation light is not detected. When examining the FITC emission channel however you can see that there is a significant amount of DAPI fluorescence (blue solid line) that would be passed by the FITC emission filter (green region). This is often a reason why individual excitation and emission filters are used; this issue goes away if no UV excitation light is striking the sample while observing FITC. In contrast, the distance between FITC emission (green line) and Texas Red emission (red line) is large enough that there is a minimal amount of FITC emission passing into the Texas Red detection channel (red region). The take-home message here is that simultaneous imaging can be performed more reliably when the emission spectra are better separated.
Antibody Labelling
While stains such as DAPI will bind to DNA, it stains the whole DNA strand rather non-specifically. Antibody labelling is another way to get fluorescent molecules coupled to the sample, and can be used to identify specific extracellular and intracellular proteins as well as specific mutations or activation regions within DNA. Different cell types express different antigens on their cell surfaces, and antibodies targeted against these antigens allow these cells to be distinguished from each other. While fluorescent molecules such as DAPI stain DNA fragments and yield morphological information on the specimen, the staining is more passive in that all DNA and some RNA is stained. Antibody labelling can be specific to sub-populations of cells or even highly specific regions of DNA. This imparts the ability to visualize the sub-cellular distribution of a wide range of biomolecules and investigate their functions at a molecular level.
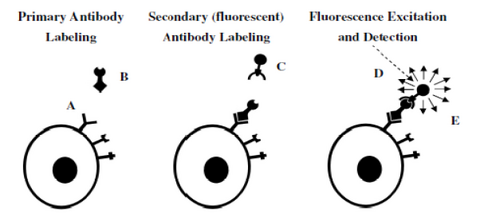
|
Figure 7– Representation of a 2-step antibody labelling process. A primary antibody is first incubated with the
sample and labels the antigen of interest (left). In a second step, a fluorescent antibody recognizing the primary
antibody labels the cell (middle). After washing any unbound labels, fluorescence from the bound fluorescent
antibody can be detected and quantified (right).
|
Figure 7 demonstrates the concept of fluorescent antibody labelling using a two-stage process (secondary labelling). First, an antibody that is specific to a particular antigen expressed on a cell is incubated with the specimen and binds to the target (left). The power of antibody labelling lies in the fact that the shape of the antibody can only fit with its unique antigen, thus after incubation and rinsing any unbound molecules are washed away. Next, a secondary antibody linked to a fluorescent molecule is incubated with the sample and allowed to bind to the primary antibody (middle). After rinsing and washing again the only fluorescent molecules remaining in the sample are those attached to the target antigen through the antibody link. Excitation/detection can then proceed by using the appropriate filter cube to visualize the localization of the fluorescence signals.
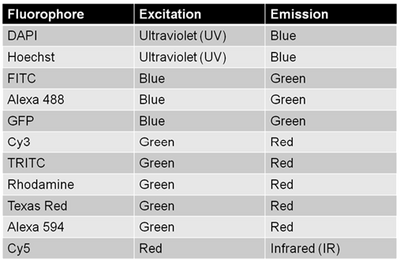
Since multiple biomarkers can be localized in a single specimen through the use of secondary antibodies that excite/emit at different wavelengths (taking cross-talk into consideration as discussed above) fluorescence labelling is a really powerful tool for cell biology. This is because in transmitted light imaging typically one or two labels can be applied to each slide, but with fluorescence imaging the number of fluorescent probes (and thus antigens/proteins studied in the same population of cells) can be significantly larger. A table of common fluorophores along with their excitation/emission wavelengths are shown in the table below.
|
|
Photobleaching
In general, the fluorescence intensity emitted by a stained specimen is linearly related to the light intensity used to excite the fluorescence. However, there are also probes available that alter their fluorescence quantum efficiency or emission spectra based on the micro-environment they are in. You will not be working with these types of probes in this lab as their use is too advanced for the limited timeframe we have, but it is good to be aware they exist.
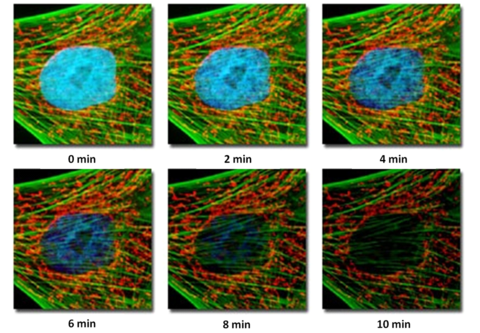
The process of fluorescence is inherently destructive to the probe molecules, and there is a limit to how much light a given fluorophore can emit before it loses its ability to fluoresce. This process is called photobleaching, and is generally the result when too much excitation power is placed on the specimen or observation continues over extended periods of time. When this occurs, the fluorescent molecules undergo a structural change which alters their ability to produce more fluorescent photons. Instead, any energy absorbed by photo-destroyed fluorophores is dissipated in a non-radiative fashion. A typical example of photobleaching is shown in Figure 8.
|
Figure 8– Example of photobleaching as a function of exposure for a fibroblast cell. Over very long exposures
simulating prolonged observation, the nuclear fluorescence has gone away, and the green fluorescence has faded.
The red fluorescence is virtually unchanged.
|
The specimen is a fibroblast cell, fluorescently labelled with three probe-antibody combinations; Hoechst 33258 (stains nuclei, excited by UV light, produces blue fluorescence), Alexa 488-phalloidin (excited by blue light, produces green fluorescence), and MitoTracker Red (stains mitochondria and cytoskeleton, excited by green light, produces red fluorescence). Images were acquired at 2-min intervals, and the level of fluorescence from the nuclear Hoechst stain can be seen to drop rapidly with exposure to the excitation light, while the signal from the Alexa 488 fluorophore drops only slightly, and the red fluorescence remains constant. Photobleaching complicates the routine use of fluorescence for quantitative studies, and care must be taken to minimize its effects. Often this involves minimizing the excitation intensity of light on the sample and detecting the fluorescence as efficiently as possible. Typically, fluorescently labelled specimens are imaged in a dark environment and are stored in a fridge or freezer protected from ambient light so their fluorescent properties are maintained. It is also very good practice to only illuminate the specimen when collecting data or observing the specimen through the oculars, then close the excitation shutter while saving data and making notes in your lab book (do not turn the lamp on and off however, as this can damage the bulb).
Fluorescence Photon Efficiency
A useful exercise to understand some of the finer points of fluorescence microscopy is to go through an estimation of the generation and detection of fluorescent light from a uniformly fluorescing sample. The excitation source is assumed, for this exercise, to be a standard 75 W xenon arc-discharge lamp having a mean luminous flux density of approximately 400 cd/mm2. When an excitation filter is used to pass blue light from 485 – 495 nm, about 2 mW of light will pass through to be directed at the sample by the DBS in the filter cube (assuming 75% transmission efficiency of the filter). Assume the DBS reflects 90% of this light towards the sample, and that gives a value of approximately 1.8 mW entering the rear aperture of the microscope objective as the excitation beam.
With a 100x/1.4 NA oil immersion objective the area of the specimen illuminated will be approximately 40 m in diameter, giving an illumination area of 12 x 10-6 cm2. The light flux on the specimen is then about 150 W/cm2, which corresponds to a flux density of 3.6 x 10²⁰ photons/cm2. This illumination intensity on the specimen is about 1000 times higher than that incident on the Earth's surface on a sunny day, yet with all this power only a fraction will generate fluorescence that is collected, passed by the optical filters and detected by your eye or the CCD camera.
The fluorescence emission that results from the light flux discussed above depends on the absorption and emission characteristics of the fluorophore, its concentration in the specimen, and the optical path length of the specimen. We are considering a uniformly fluorescing material, and in mathematical terms the fluorescence produced (F) is given by the equation:
|
|
