Main Page/PHYS 4210/SonoluminescenceDev
Sonoluminescence and Blackbody Radiation
Sonoluminescence is the process by which a gas bubble trapped at the antinode of an ultrasonic standing wave emits visible radiation. This strange phenomenon will be the platform on which 3-dimensional standing waves and black-body radiation will be investigated.
Introduction
Single bubble sonoluminescence, hereafter abbreviated as SL, was discovered in the late 1980's and has received a great deal of attention. This remarkable process involves the trapping of gas bubble at the antinode of a ultrasonic standing wave in a liquid.
3D Standing Waves
Waves in three-dimensional space can be described by the wave equation.
 | (1) |
In a rectilinear coordinate system, the solution to the wave equation has the following form:
|
| (2) |
Where X,Y, and Z have the familiar forms:
 | (3) |
The sin is chosen when the boundary is a pressure release (i.e. not rigid) and the cos is chosen when the boundary is rigid and the velocity at the boundary must be zero. The eigen frequencies are given by:
 | (4) |
where nx,ny, and nz are the orders of the mode, and Lx, Ly, and Lz are the physical dimensions of the cavity.
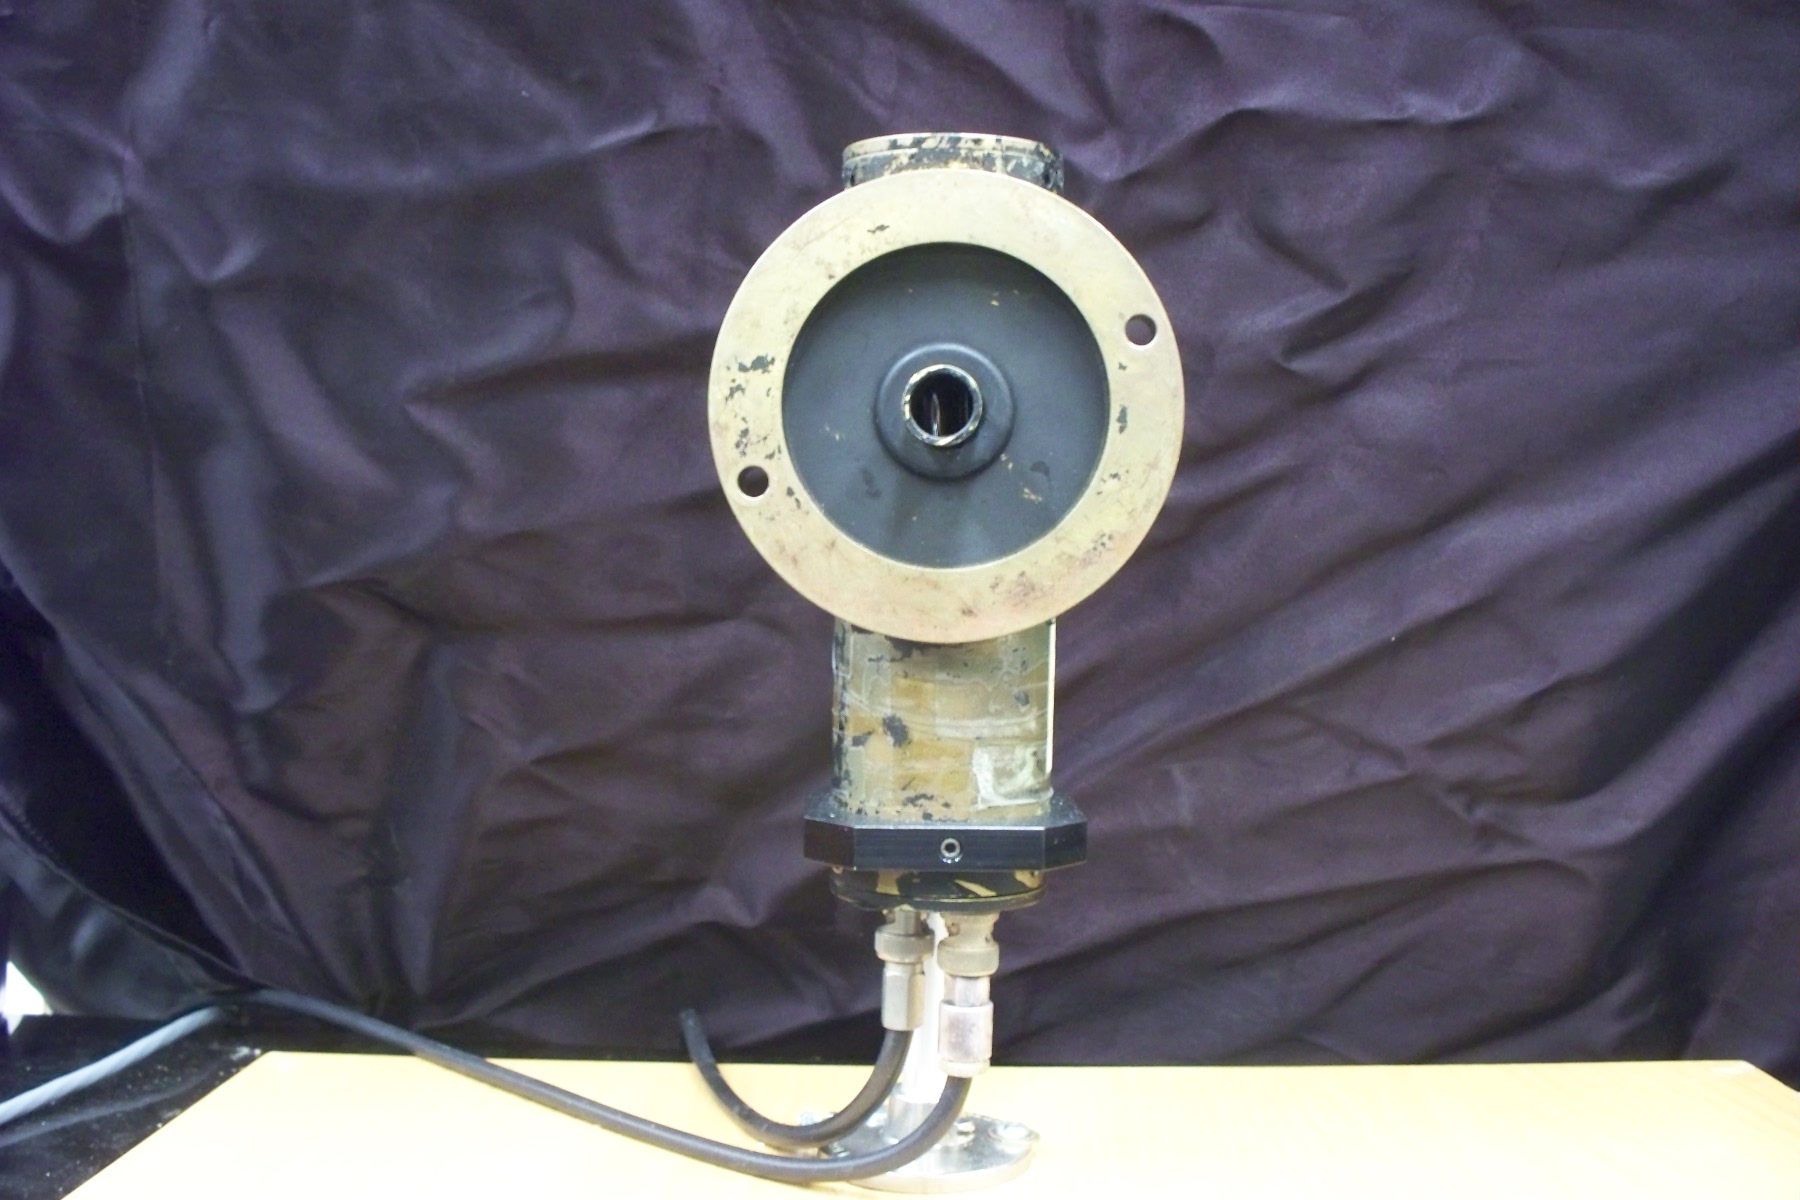
The Ultrasonic Horn
The ultrasonic horn is used to deliver acoustic power to the volume of water. Internally, the horn contains a series of annular shaped disc transducers which are bolted into its base. The basic structure and shape of the horn is designed to efficiently couple the pressure waves generated from the transducers to the narrow stem of the horn. All of the transducers are the same. They consist of a ceramic material which has been prepared in such a manner as to have a permanent polarization. In other words,there are specialized capacitors. As a charged is placed across this capacitor there is a force generated across the ends, and the capacitor wants to separate. Since the transducers are compressed, this repulsive force does not physically expand the disc but does produce dynamic pressure. As the charge across the transducer is reversed, there is now an attractive force which results in a negative pressure amplitude. The capacitance of the particular tranducers used is 11 nF. In order to efficiently couple electrical power into the transducers, it is advantageous to connect an inductor in series to achieve electrical resonance as given by the formula:
The Cell
The cell is a plastic container onto which is epoxied a small ceramic transducer that serves as a microphone. Since this transducer is not compressed small fluctuations in its diameter produce a measurable signal. By attaching this transducer to the bottom of the cell, one can easily detect when the pressure is the cell in in resonance by looking for large amplitude sine waves on a oscilloscope at the ultrasonic frequency. The cell is provided with a black shroud which serves which has a circular opening on one side to allow for light from the SL to enter the photomultiplier tube.
The Photomultiplier Tube
A photomultiplier tube (PMT) is a device which coverts one incident photon into a large pulse of electrons which can then be read out on an oscilloscope. The photon passes through the glass enclosure of the PMT an liberates an electron from a coated surface, this electron is then accelerated by static electric fields into dynode 1, and this initial electron free many more electrons. This bunch of electron then accelerates into dynode 2 freeing a larger bunch of electrons. This process continues many times such that even one incident photon can produce a measurable number of electrons at the output. A PMT is a very sensitive optical detector. Due to the high sensitivity, having too many photons entering the PMT can damage the device, and this should be avoided. Even with the black shroud covering the cell, you should not apply power to the PMT without also shutting of the room lights.
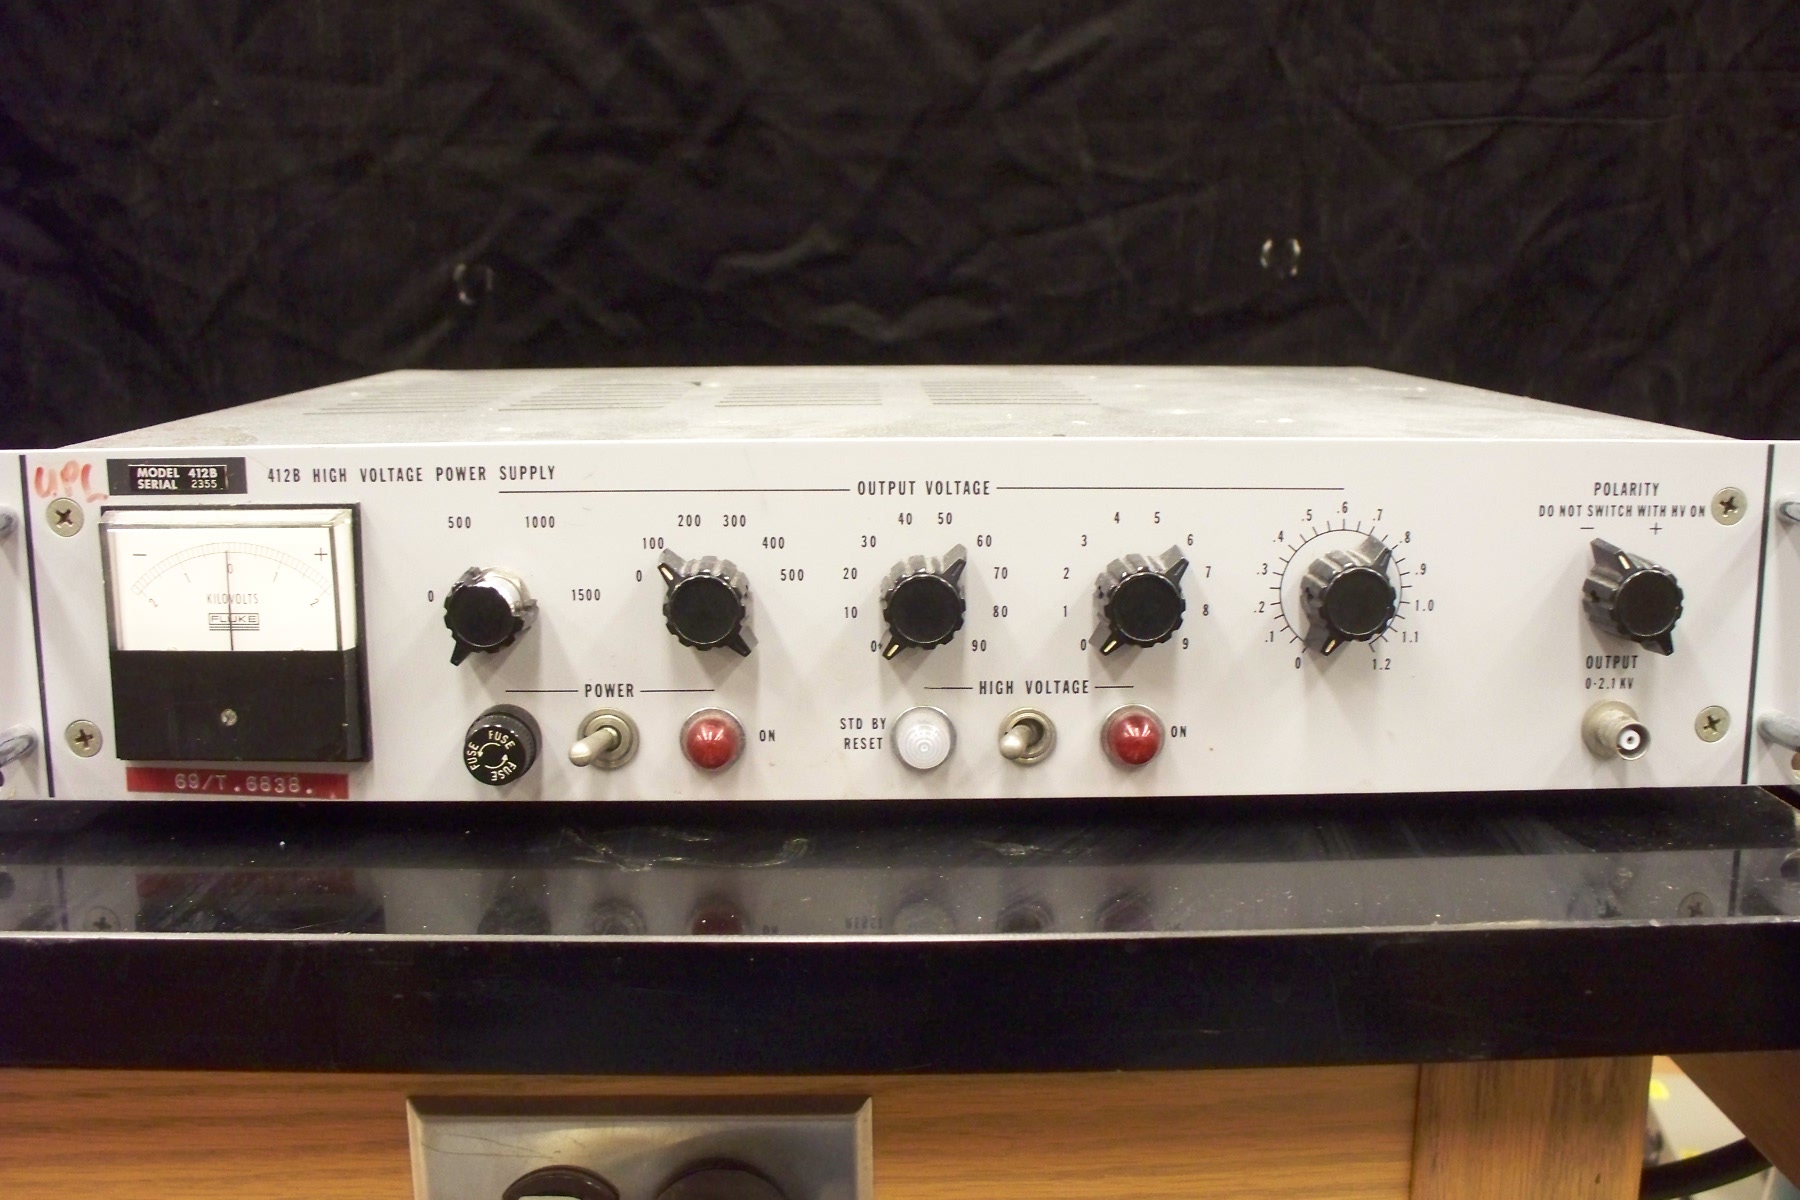
The Fluke 412B power supply will provide the high voltage required to bias the dynodes of the PMT. Typically, the PMT should be run at 1000 V. The PMT will output a negative going pulse with a sharp rise time and a relatively slow fall time. The amplitude of this pulse is related to the number of photons hitting the PMT during a particular pulse. In this experiment, the effect of Sonoluminescence only occurs once during an acoustic wave period, hence, the SL bubbles is flashing at around 27 kHz. The PMT will output pulses synchronized with the acoustic frequency whose amplitude is related to the brightness of the sonoluminescence.
The particular ultrasonic horn used has components which make it tuned for a frequency from 25kHz to 27kHz. Outside of those ranges, the acoustic energy available in the horn is strongly attenuated.
BlackBody Radiation
For a full treatment of blackbody radiation, refer to any Modern Physics textbook. All matter with a temperature greater than 0 Kelvin emits electromagnetic radiation. This common phenomenon is noticed in everyday life when you look inside your toaster, use a stove-top, or bask in the sunshine. The spectrum of emitted radiation depends on the properties of the particular material, and the temperature as described by Planck's Formula:
 | (5) |
Related to Planck's formula is the Wien Displacment Law, which describes the wavelength at which the most energy is being emitted.
 | (6) |
Using the above formula, one can determine that the Sun, which appears yellow (~500nm) has a surface temperature of around 5800 K. In this experiment, you will be amazed to see the SL bubbles emitting blue/white radiation, suggesting a much higher temperature!
Procedure
Required Components
- Flask
- De-ionized Water
- Vacuum Pump
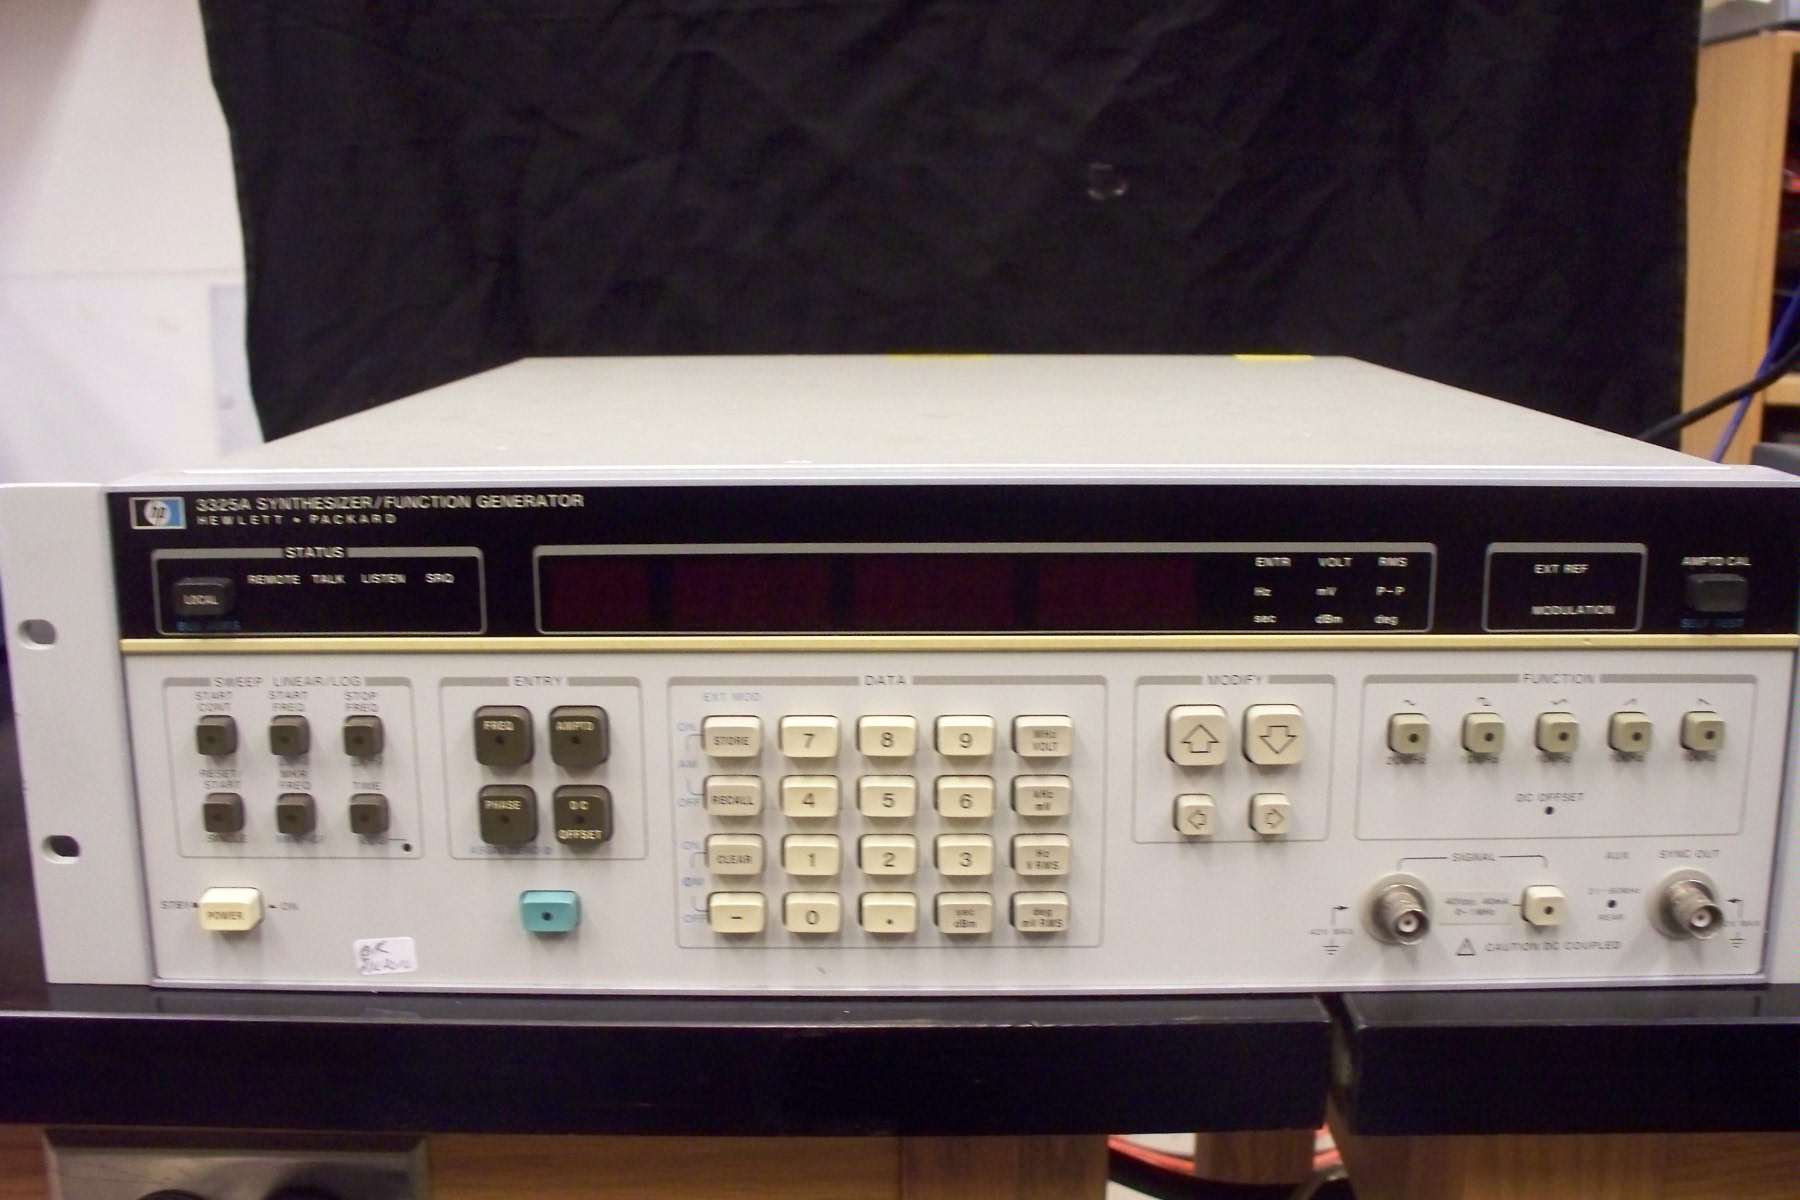
- HP33258 Function Generator
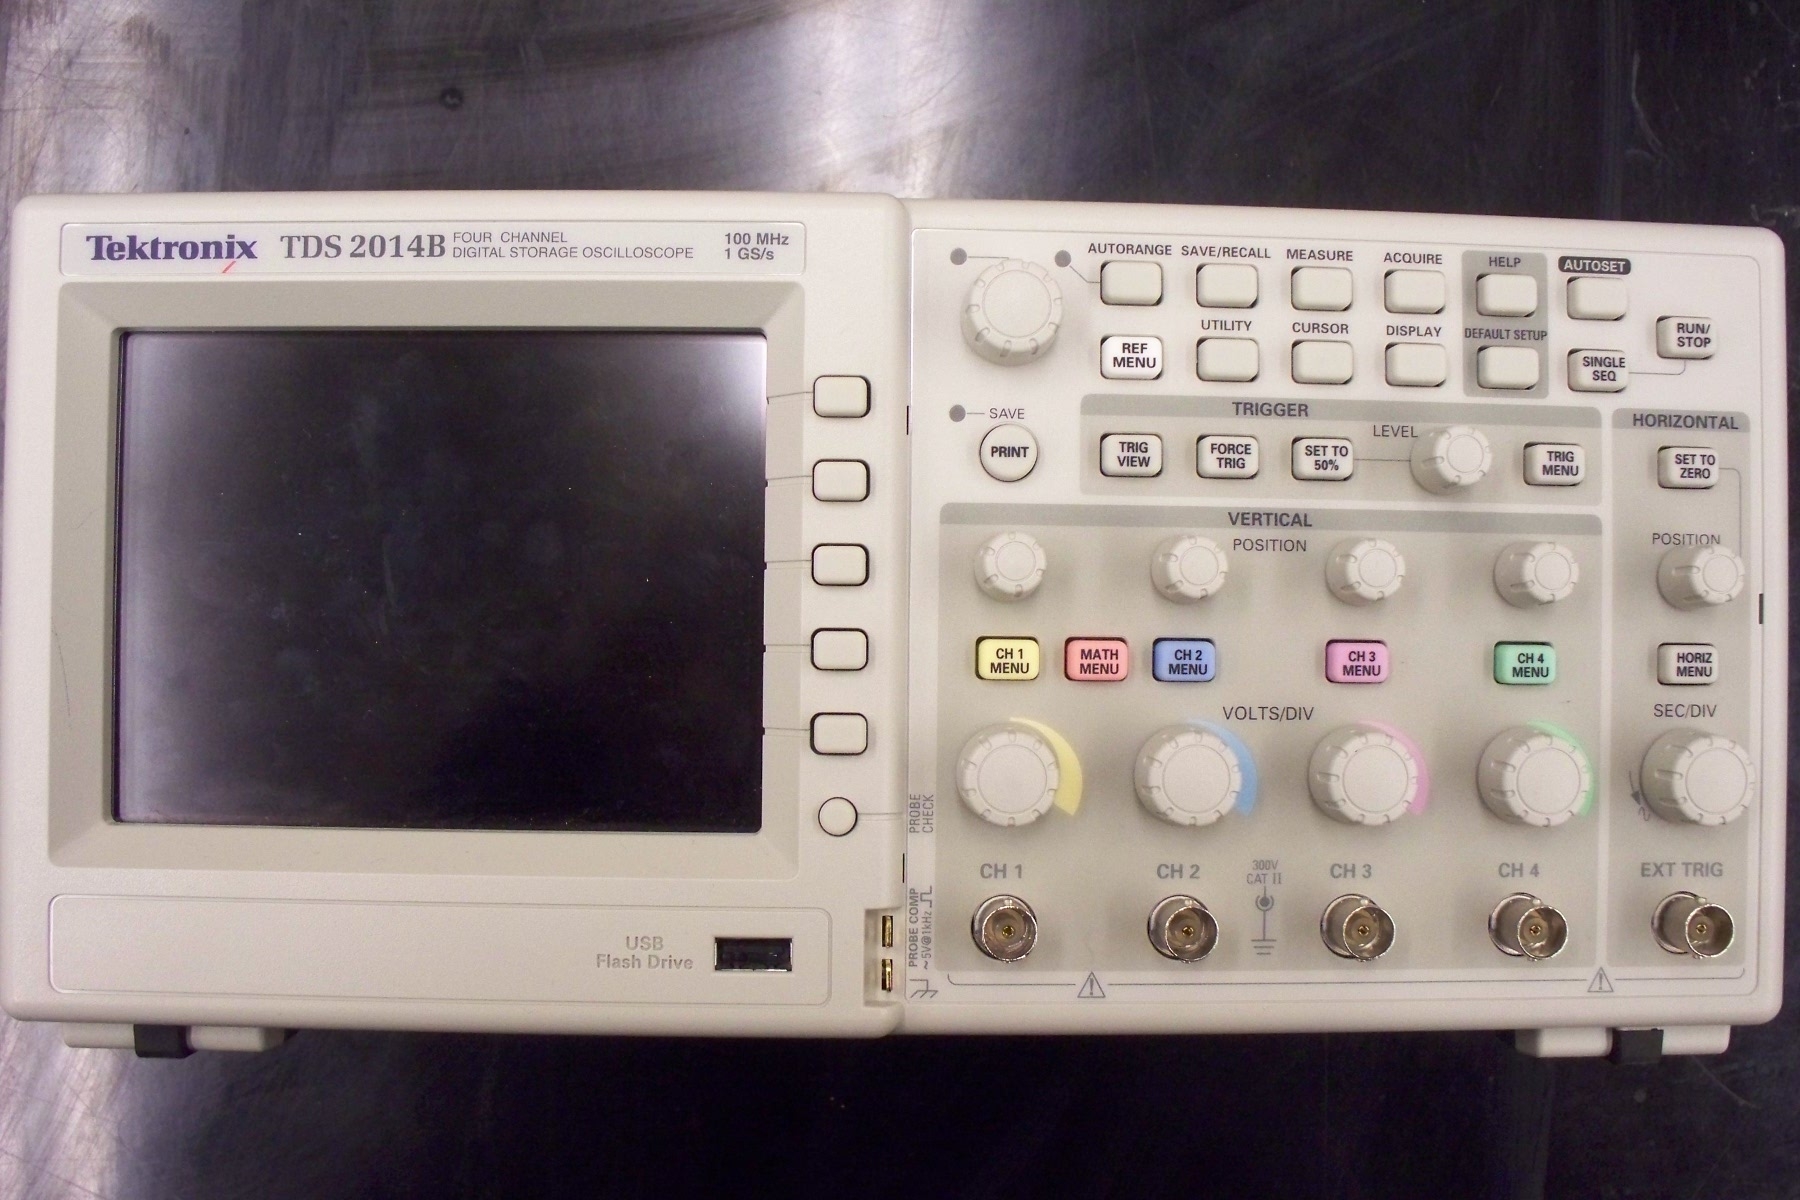
- TDS2014B Digital Oscilloscope
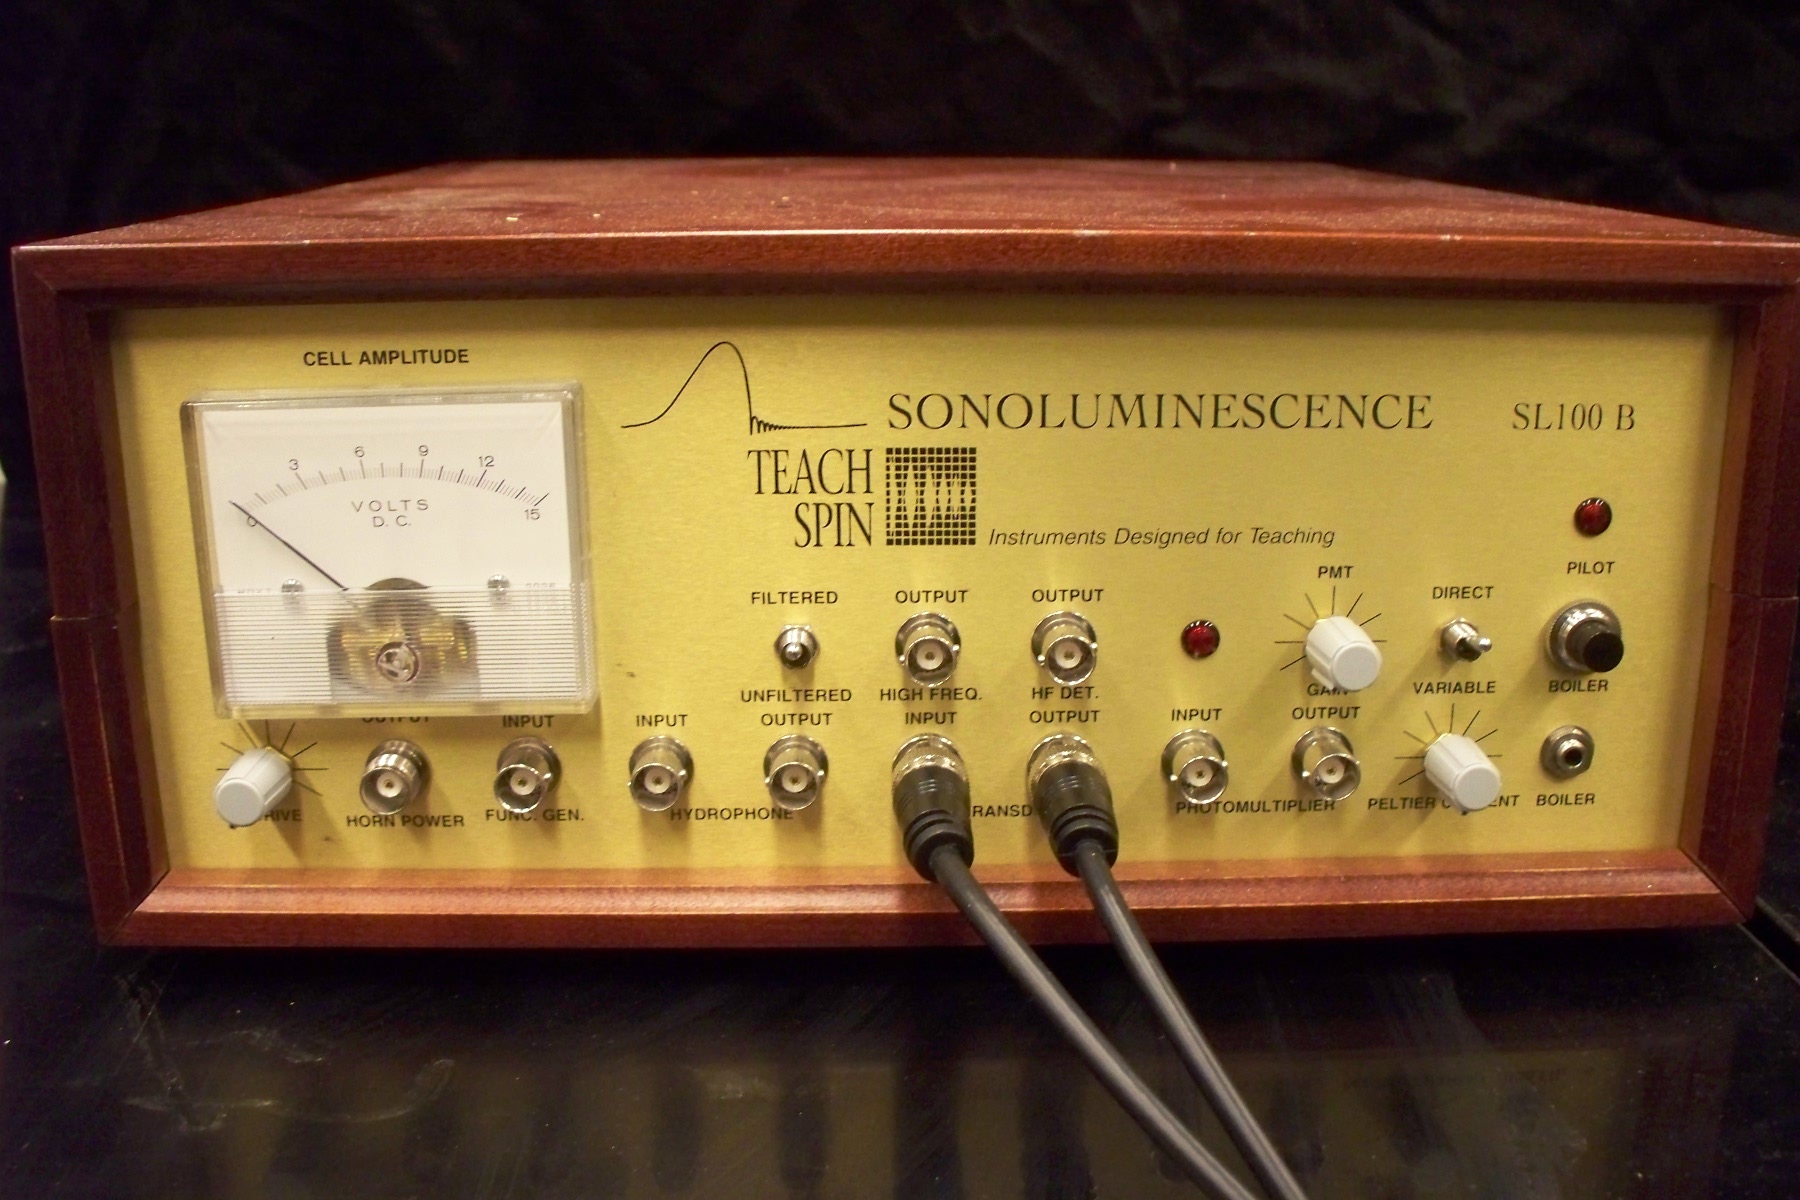
- SL100B Sonoluminescence Control Box
- Ultrasonic Horn
- 1P28 PhotoMultiplier Tube
- Various Optical Filters
- HV Power Supply
Degas the water
In order for the water to support a sonoluminescence bubble it is necessary for the water to be partially degassed. To do this, starting will deionized water in a flask, place a rubber stopper in the top of the flask with a tube passing though it, then attach a roughing pump to end of the tube. The boiling point of water is reduced to below room temperature if the pressure in the flask can be reduced below about 25 torr. The vacuum pump you are using can easily achieve that. You will notice rapid bubbling of the water inside the flask after the pump is turned on. Allow to pump to work for at least 45 minutes. Gently shaking the flask from time to time while pumping will help ensure more thorough degassing. In addition, during the degassing procedure, have the flask sitting in a bath of ice water, as the sonoluminescence effect is greater when the liquid is at lower temperatures.[1]
 Figure 1 - Degassing the water.
|
Once the degassing procedure is complete, turn off the vacuum pump, and slowly open the pressure relief wave. Then, gently pour the water into the cell being careful not to introduce more bubbles. Fill the cell to the correct level to create standing waves of the desired order.
Electrical Connections
The basic setup for the experiment is shown below. The acoustic frequency is provided by a 1 Vpp sine wave from the HP3325A synthesizer/function generator. The appropriate resonance frequency, as determined by cell geometry is around 26kHz. This sine wave is then amplifier by the SL100B control box, and fed into the ultrasonic horn. To electronically view the effects of sonoluminescence, the output of cell transducer is put to Channel A of the oscilloscope, Channel B of the scope should be the High Freq. Output of the transducer. This High Freq. Output filters the cell transducer signal with 150 kHz high-pass filter since the effect of a trapped bubble is to cause a high frequency response. There are two connections made from the Sonoluminescence SL100B to the cell box- a multi-pin power/control cable, and cell transducer input using coaxial connector.
 Figure 2 - Electrical Connections.
|
Observe trapped bubbles and Sonoluminescence
Once the water is added, place the black shroud around the cell. Lower the ultrasonic horn into the cell such that the tip of the horn is 5mm - 10mm below the surface of the water. Set the drive amplitude of the ultrasonic horn to 3/4 of maximum. The frequency of the function generator should be adjusted in steps of 10Hz to maximize the signal picked up by the cell transducer. The cell amplitude voltage can be read on the analog meter of the SL100B and should be at least 4V. When you are near the resonance you will see the amplitude rapidly increase as you adjust the frequency, and then begin to decrease as you continue increasing the frequency. Record and plot this relationship between applied frequency and cell transducer voltage. Typically, the quality factor of the resonance should be on the order of 100 to 200.
Return to the peak of acoustic resonance, the drive amplitude should be adjusted such that as viewed on an oscilloscope, the output of the cell transducer is an undistorted sine wave.
Now that there is an acoustic standing wave inside of the cell, you can attempt to trap a bubble. To introduce a bubble into water, submerge the heater filament such that it is near (but not touching) the bottom of the cell. Briefly press the boiler button on the SL100B, this will boil a tiny amount of water near the filament creating small bubbles. With the room lights on, you should then be able to see a bubble held stationary in the cell at the location of an antinode. Now, turn off the room lights except for a small desk lamp. You may be able to see the bubble giving off a blueish-white light. If you cannot see the sonoluminescence, try increasing the drive amplitude- keeping an eye on the oscilloscope to ensure a bubble is still trapped. If you loose the bubble from the trap, you will need to load the trap again with another bubble.
 Figure 3a - No evidence of trapped bubble on oscilloscope.
|
 Figure 3b - Clear evidence of trapped bubble on oscilloscope.
|
Questions
- What mode is being excited the acoustic wave?
- Draw the a sketch illustrating this mode inside of the cell, and indicate possible locations to trap bubbles.
Detect the Sonoluminescence using a PMT
With the HV power supply still switched off, adjust the height of the PMT and bring it close to the opening in back of the black shroud. Once you have a trapped, sonoluminescence bubble, close the front viewing flap. Turn on a small desk lamp, and shut off the main room light. Turn on the HV power supply to about 1000V and look on the oscilloscope for pulses synchronous with the acoustic radiation. If the peak of the pulses exceeds 500mV, lower the operating voltage of the PMT by 50V.
Questions
- Sketch or present the waveforms of for the cell transducer output and "High Freq. Output" when a bubble is trapped.
- Determine the rise time and decay time of the PMT pulses.
- What distribution of peak heights do you observe?
Determine the Temperature of the SL
To determine the temperature of the SL bubble, we will use the assumption that the amplitude of the peak output from the PMT is proportional to the number of photons input to the PMT. There are some important factors which first need to be considered.
The SL bubble is inside of the cell, and light has to travel half of the cell thickness through water. The absorption of water as a function of wavelength is:
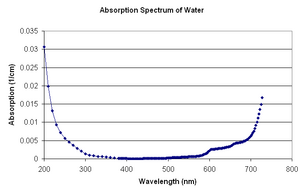
A table of the above values is given here: Water_Absorption.xls, Water_Absorption.txt
- The photons from the SL must then pass through the plastic cell wall. For the purpose of our measurement, we will assume that all wavelengths pass through equally. Comment on the suitability of this assumption for light in the visible spectrum.
The PMT does not respond equally for all wavelengths. The efficiency as a function of wavelength is shown below.
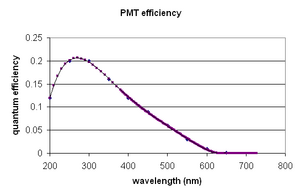
Figure 5 - PMT Efficiency.[4].
A table of the above values is given here: SL_PMT_efficiency.xls, SL_PMT_efficiency.txt


In addition to the above effects, you are provided with four optical filters which you will use to attenuate the SL in a controlled way. The transmission properties of each of the four filters is given in the figure below.
 Figure 6 - Filter transmission as function of wavelength.
|
A table of the above values is given here: SL_filters.xls, SL_filters.txt
It is your task to determine the temperature the sonoluminescence bubble based on the ratio of the average pulse heights of the PMT signals when the various filters are in place, taking into account the known absorptions and efficiencies of the system. Please carefully explain the algorithm for your analysis in your write-up.
References
- ↑ G.E. Vazquez and S.J. Putterman, Phys. Rev. Lett., 85, 3037 (1999)
- ↑ R. C. Smith and K. S. Baker, "Optical properties of the clearest natural waters (200-800nm)," Appl. Opt., 20, 177 (1981).
- ↑ R. M. Pope and E. S. Fry, "Absorption spectrum (380-700nm) of pure water. II. Integrating cavity measurements," Appl. Opt., 36, 8710 (1997).
- ↑ Taken from Hamamatsu 1P28 datasheet