Difference between revisions of "Main Page/BPHS 4090/Choloplast Translocation"
| (11 intermediate revisions by 5 users not shown) | |||
| Line 1: | Line 1: | ||
<h1>Required Components</h1> | <h1>Required Components</h1> | ||
<ol> | <ol> | ||
| − | <li>Stock culture of <i>Eremosphaera viridis</i></li> | + | <li>[[Media:M3_Viridis.JPG|Stock culture of <i>Eremosphaera viridis</i>]]</li> |
| − | <li>Glass slides, cover slips and micropipette</li> | + | <li>[[Media:Slide_Tools.JPG|Glass slides, cover slips and micropipette]]</li> |
<li>Nikon Optiphot Microscope</li> | <li>Nikon Optiphot Microscope</li> | ||
<li>Radiometric Probe (Model S471 Portable Optometer, UDT Instruments)</li> | <li>Radiometric Probe (Model S471 Portable Optometer, UDT Instruments)</li> | ||
| − | <li>Cool Snap CCD Camera and MicroManager software</li> | + | <li>[[Media:CCD.JPG|Cool Snap CCD Camera and MicroManager software]]</li> |
| − | <li>Blue and red band-pass filters</li> | + | <li>[[Media:M3_Band_Pass.JPG|Blue and red band-pass filters]]</li> |
</ol> | </ol> | ||
| Line 46: | Line 46: | ||
<p>The first step in the conversion of the energy of photons to chemical energy is absorption by | <p>The first step in the conversion of the energy of photons to chemical energy is absorption by | ||
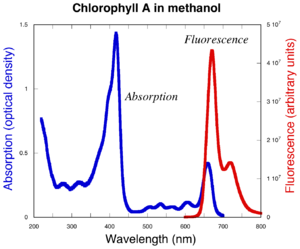
photosynthetic pigments, principally chlorophyll. The absorption spectrum of chlorophyll a is shown in | photosynthetic pigments, principally chlorophyll. The absorption spectrum of chlorophyll a is shown in | ||
| − | Figure 1 | + | Figure 1.</p> |
<table width=800 align=center><td> | <table width=800 align=center><td> | ||
| − | <p align=justify>[[File: | + | <p align=justify>[[File:Chlorophyll_a_spectrum.png|300px|left]] |
<b>Absorption Spectrum of Chlorophyll a:</b> Chlorophyll a strongly absorbs | <b>Absorption Spectrum of Chlorophyll a:</b> Chlorophyll a strongly absorbs | ||
light at 465nm and 665nm. There is minimal | light at 465nm and 665nm. There is minimal | ||
absorption of UV light as well as green/yellow light | absorption of UV light as well as green/yellow light | ||
which appears in the range of 500nm-600nm. These | which appears in the range of 500nm-600nm. These | ||
| − | absorbances are for | + | absorbances are for chlorophyll isolated in a |
solvent of a well-defined dielectric. In the cell, | solvent of a well-defined dielectric. In the cell, | ||
additional pigments and heterogeneous dielectric | additional pigments and heterogeneous dielectric | ||
| Line 61: | Line 61: | ||
</p> | </p> | ||
</td></table> | </td></table> | ||
| + | |||
| + | |||
| + | |||
| + | <table align=right border=0 width=400> | ||
| + | <tr><td>[[File:Fluorescence_scans.png|200px|left]]</td> | ||
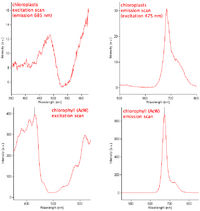
| + | <td><b>Determining excitation and emission spectra</b><br>Here is an example of absorbance/fluorescence scans of whole algal cells and acetone/water extracted chlorophyll to give you an idea about the kind of absorbance that occurs | ||
| + | during light irradiation of your cells.<ref>http://biologywiki.apps01.yorku.ca/index.php?title=Main_Page/BIOL_4160/Determining_Excitation_and_Emission_Spectra</ref></td></tr> | ||
| + | </table> | ||
<p>Chlorophyll is located inside the thylakoid vesicles in the inner membrane of the chloroplast. After | <p>Chlorophyll is located inside the thylakoid vesicles in the inner membrane of the chloroplast. After | ||
| Line 255: | Line 263: | ||
<b>C:\BPHS4090_Viridis_Systrophe, label your data by your name, date and title of work.</b> This | <b>C:\BPHS4090_Viridis_Systrophe, label your data by your name, date and title of work.</b> This | ||
will create a file folder with all the images you acquired.</li> | will create a file folder with all the images you acquired.</li> | ||
| − | <table width= | + | <table width=300 align=center><td> |
| − | <p align=justify>[[File:Ct_fig9.png| | + | <p align=justify>[[File:Ct_fig9.png|250px|center]] |
<b>Figure 9:</b> Sequence Options. | <b>Figure 9:</b> Sequence Options. | ||
<br clear=right> | <br clear=right> | ||
| Line 281: | Line 289: | ||
in your imported stack.</li> | in your imported stack.</li> | ||
| − | <table width= | + | <table width=400 align=center><td> |
| − | <p align=justify>[[File:Ct_fig10.png| | + | <p align=justify>[[File:Ct_fig10.png|350px|center]] |
<b>Figure 10:</b> Adjusting Image Brightness and Contrast. | <b>Figure 10:</b> Adjusting Image Brightness and Contrast. | ||
<br clear=right> | <br clear=right> | ||
| Line 308: | Line 316: | ||
<h1> Questions/Write-up </h1> | <h1> Questions/Write-up </h1> | ||
| − | <p> | + | <p>Answer the following questions in your lab notebook.</p> |
| + | <ol> | ||
| + | <li>An additional experiment was performed [8] by illuminating only half the cell at a time. The | ||
| + | results of this experiment are shown below: | ||
| + | <table width=700 align=center><td> | ||
| + | <p align=justify>[[File:Ct_fig11.png|700px|center]] | ||
| + | <b>Figure 11:</b> Half Cell Illuminations: This particular cell was illuminated under broad band-pass | ||
| + | irradiation with a photon flux of <b>1500μmol m<sup>-2</sup> s<sup>-1</sup>.</b> After an hour of irradiation, chloroplasts have | ||
| + | vacated the illuminated area. | ||
| + | <br clear=right> | ||
| + | </p> | ||
| + | </td></table> | ||
| + | <p>What can you conclude about these results? Is chloroplast translocation a protective | ||
| + | mechanism for the cell or rather an avoidance mechanism? Explain in a few sentences.</p></li> | ||
| + | |||
| + | <li>Imagine you had a source of UV light available and you wished to perform an additional | ||
| + | experiment by illuminating the cells with UV light as you did earlier with the blue and red bandpass | ||
| + | filters. Assume your UV light source emits at a peak wavelength of 250nm ± 10nm. Taking | ||
| + | into account the absorption spectra of chlorophyll shown in Figure 1 and that DNA absorbs light | ||
| + | at 260nm what would you expect to happen?</li> | ||
| + | |||
| + | <li>During this lab we examined the wavelength dependence of light on systrophe, however other | ||
| + | experiments [8] demonstrated there is also an intensity dependence as shown in the Figure | ||
| + | below:</li> | ||
| + | |||
| + | <table width=500 align=center><td> | ||
| + | <p align=center>[[File:Ct_fig13.png|500px|center]] | ||
| + | <b>Figure 13:</b> Intensity Dependence of Light on Incipient and Complete Systrophe. | ||
| + | <br clear=right> | ||
| + | </p> | ||
| + | </td></table> | ||
| + | |||
| + | <p>At a photon flux of around <b>2000μmol m<sup>-2</sup> s<sup>-1</sup></b> there is a dramatic increase in the number of | ||
| + | incipient systrophe. Remember incipient means the cells are in the process of undergoing | ||
| + | chloroplast translocation. The photon flux we receive from the sun is around <b>2000μmol m<sup>-2</sup> s<sup>-1</sup></b>. | ||
| + | What does this imply?</p></li> | ||
| + | |||
| + | <li>Photosynthetic organisms use wavelengths between 400nm and 800nm for photosynthesis. | ||
| + | From Figure 1, it can be seen that chlorophyll strongly absorbs blue and red light. Taking this | ||
| + | into account and your answers to questions 1 and 2 what role do you think systrophe plays in | ||
| + | photosynthesis? Are they related? Please discuss in a few sentences providing insights into | ||
| + | your thinking process.</li> | ||
| + | </ol> | ||
| + | |||
| + | <p>For the formal write-up for this experiment, briefly describe the purpose of the experiment, the | ||
experimental set-up and the physics behind the biological process we’re observing, this will be your | experimental set-up and the physics behind the biological process we’re observing, this will be your | ||
introduction. You should type up your results into a table comparing the illumination trials using red | introduction. You should type up your results into a table comparing the illumination trials using red | ||
and blue filters. Provide a brief discussion interpreting your results. In addition you need to provide | and blue filters. Provide a brief discussion interpreting your results. In addition you need to provide | ||
| − | answers to the | + | answers to the following questions.</p> |
<ol> | <ol> | ||
<li>The effect of systrophe is thought to be a defence mechanism for the cell by decreasing the | <li>The effect of systrophe is thought to be a defence mechanism for the cell by decreasing the | ||
| Line 361: | Line 413: | ||
</li> | </li> | ||
| − | |||
| − | |||
| − | |||
| − | |||
| − | |||
| − | |||
| − | |||
| − | |||
| − | |||
| − | |||
| − | |||
| − | |||
| − | |||
| − | |||
| − | |||
| − | |||
| − | |||
<li>Open the spreadsheet titled <b>“Viridis_Systrophe_Spectrum.xls”</b>; this is an emission spectra of | <li>Open the spreadsheet titled <b>“Viridis_Systrophe_Spectrum.xls”</b>; this is an emission spectra of | ||
the tungsten halogen bulb used for illuminating the cell. Calculate the total energy the cells | the tungsten halogen bulb used for illuminating the cell. Calculate the total energy the cells | ||
| Line 398: | Line 433: | ||
</td></table> | </td></table> | ||
| − | |||
| − | |||
| − | |||
| − | |||
| − | |||
| − | |||
| − | |||
| − | |||
| − | |||
| − | |||
| − | |||
| − | |||
| − | |||
| − | |||
| − | |||
<li>During systrophe chloroplasts are translated across the cell by molecular motors. It isn’t known | <li>During systrophe chloroplasts are translated across the cell by molecular motors. It isn’t known | ||
exactly which molecular motors are responsible for chloroplast translocation, however it should | exactly which molecular motors are responsible for chloroplast translocation, however it should | ||
| Line 431: | Line 451: | ||
the energy mechanisms involved during systrophe? | the energy mechanisms involved during systrophe? | ||
</li> | </li> | ||
| − | + | ||
| − | |||
| − | |||
| − | |||
| − | |||
<h1>References</h1> | <h1>References</h1> | ||
<References/> | <References/> | ||
Latest revision as of 06:47, 10 August 2012
Contents
Required Components
- Stock culture of Eremosphaera viridis
- Glass slides, cover slips and micropipette
- Nikon Optiphot Microscope
- Radiometric Probe (Model S471 Portable Optometer, UDT Instruments)
- Cool Snap CCD Camera and MicroManager software
- Blue and red band-pass filters
Objective
To observe the wavelength dependence of light on chloroplast translocation in the acidophile green algae Eremosphaera viridis as well as describing a mechanism behind this response.
Introduction
Electromagnetic radiation is the driving force for photosynthesis. Plants and other autotrophs convert the energy of light into chemical energy used for synthesizing carbohydrates and other organic compounds, which heterotrophic organisms use for energy and other nutritional requirements. Photosynthesis is a unique process performed by plants, algae, and some species of bacteria. It consists of a series of oxidation and reduction reactions; the basic chemical formula is shown below:
|
|
Photosynthesis would not be possible without the energy derived from light. Electromagnetic radiation enters the earth’s atmosphere from the sun where it is harvested by photosynthetic organisms. Wavelengths between 400 and 800 nm are used by photosynthetic organisms. The sun can be approximated as a near perfect blackbody with a surface temperature of 5800 K described by Planck’s Black Body Radiation Law, shown in Equation 1.1
|
|
Where U (λ, T) has units of J m-2 s-1, h is Planck’s constant, K is Boltzmann’s Constant and c is the speed of light. The color temperature of the sun corresponds to a peak wavelength emission of about 500nm according to Wien’s Displacement Law (Equation 1.2)
|
|
Where b = 2.898 x 10⁻³ in units of m*K.
The first step in the conversion of the energy of photons to chemical energy is absorption by photosynthetic pigments, principally chlorophyll. The absorption spectrum of chlorophyll a is shown in Figure 1.
|
Absorption Spectrum of Chlorophyll a: Chlorophyll a strongly absorbs
light at 465nm and 665nm. There is minimal
absorption of UV light as well as green/yellow light
which appears in the range of 500nm-600nm. These
absorbances are for chlorophyll isolated in a
solvent of a well-defined dielectric. In the cell,
additional pigments and heterogeneous dielectric
causes much broader peaks.
|
| Determining excitation and emission spectra Here is an example of absorbance/fluorescence scans of whole algal cells and acetone/water extracted chlorophyll to give you an idea about the kind of absorbance that occurs during light irradiation of your cells.[1] |
Chlorophyll is located inside the thylakoid vesicles in the inner membrane of the chloroplast. After absorbing a photon, an electron in chlorophyll transitions to an excited state. The excited state electron (exciton) is transferred to a photosynthetic reaction center to begin the flow of electrons through the electron transport chain, eventually to produce ATP (from a transmembrane H+ gradient) and reducing equivalents (NADP + 2e– + 2H+ —> NADPH + H+). Chlorophyll, now with one less electron, is chemically unstable and receives an electron from a water molecule (H2O). With the loss of 4 electrons from two molecules of water, molecular oxygen (O2) is produced, as well as 4H+ used for ATP synthesis. Oxygen, the waste product of photosynthesis, is vital for heterotrophs in the process of cellular respiration.
As light intensity increases, so do absorption events and the generation of excited state chlorophylls, and downstream electron transport. At a high enough light intensity, these can cause the formation of a variety of undesirable oxidative products that can damage the photosynthetic apparatus. Examples include triplet state chlorophyll, and various reactive oxygen species (through direct reduction of O2 to O2–, and subsequent formation of H2O2). The general term photo-oxidation is used to describe this damaging process. There are protective mechanisms to avoid oxidative damage [2]; one of these may be to decrease the absorptive cross-sectional area of chloroplasts by changing their location in the cell [3]. The phenomenon known as systrophe is described as the accumulation of cytoplasmic organelles around the nucleus [4][5][6]. Systrophe of the chloroplasts is observed in the unicellular green algae Eremosphaera viridis when the cell is exposed to intensities of light greater than it would experience in its natural environment.
During this experiment we will be examining chloroplast translocation in the unicellular green algae Eremosphaera viridis, in particular we will be looking at the wavelength dependence of light on systrophe. A typical cell of E. viridis is shown in Figure 2 during the course of a light treatment protocol.
|
Figure 2: Examples of incipient and Complete Systrophe in Eremosphaera
viridis This particular cell was illuminated with a photon flux of 200 μmol m-2 s-1 using a blue bandpass filter with a peak wavelength of 441nm ± 10nm.
|
From Figure 2, it can be seen that the systrophe effect is quite dramatic! At 0 minutes is how the cell would appear in its resting state, at 20 minutes into the light treatment protocol there are signs of chloroplast translocation, this cell would be classified as incipient systrophe since it is in the process of undergoing systrophe. Lastly at 60 minutes into the light treatment the cell would be classified as complete systrophe. Notice at 60 minutes the cytoplasmic strands which chloroplasts migrate along during light treatments are clearly visible!
An Eremosphaera viridis cell has about 400 chloroplasts, based on counting of medial sections of fluorescence images. In a normal chloroplast, there is about 9•10–13 g of chlorophyll and about 6.7 • 108 chlorophyll molecules per chloroplast. The molecular weight of chlorophyll a is about 894; its extinction coefficient is 1.2 • 105 M–1 cm–1 at 430nm [7].
Materials and Methods
The procedure is divided into four sections:
- Preparing a sample slide
- Microscope Set-Up and Kohler Illumination
- Light Treatments
- Image Processing
Please follow them in order; each section has its own set of step by step instructions.
- Preparing a Sample Slide
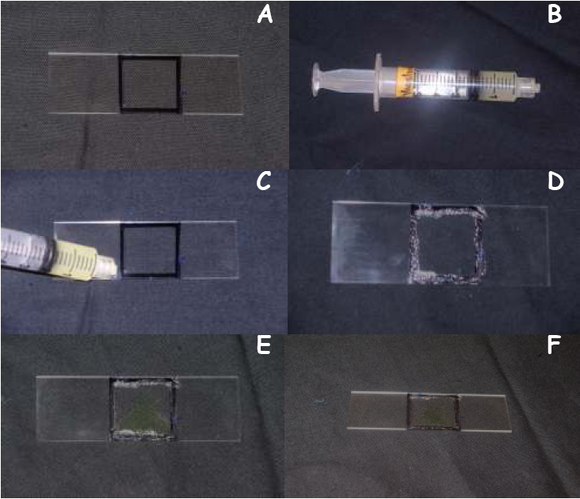
- Take a new glass slide and trace the outline of the cover slip using a permanent black marker as shown in Figure 3A.
- Spread a thin layer of Vaseline as shown in Figure 3C & D along the outline you just traced using the syringe (Figure 3B), this will prevent your cell sample from drying out under high light tensities
- Aliquot 10μL of E. viridis in the outline you just traced using a micropipette as shown in Figure 3E
- Gently place the cover slip on top of the Vaseline layer, being careful not to crush your cell sample
- Now the slide is ready to be used for light treatments (Figure 3F).
- Microscope Set-up and Kohler Illumination:
- This experiment will be performed using bright-field microscopy. Ensure the ring on the condenser diaphragm is set at 0 (not PH 1 or PH 2), because the phase ring at the PH1 or PH2 setting attenuates the light.
- Once your specimen slide is prepared, bring it to the microscope and focus on the specimen under the x10 objective.
- Next close the field diaphragm all the way shut so you can see the edges, they may appear blurry.
- Use the condenser focus knob to bring the edges of the field diaphragm into the best possible focus.
- Next use the condenser-centering screws to bring the closed field diaphragm into the center of the field of view.
- Then open the field diaphragm such that it is slightly larger than the field of view.
- You are now set up for Kohler illumination.
- Light Treatments
- Take the blue band-pass filter labelled 441nm and place it above the light source under the condenser diaphragm.
- Double click on the Desktop folder called BPHS_4090_Viridis_Systrophe, and then open the Excel spreadsheet called “Photon_Flux_Calculator.xls”. This spreadsheet is already programmed to do all the difficult calculations for you to save you time in the lab!
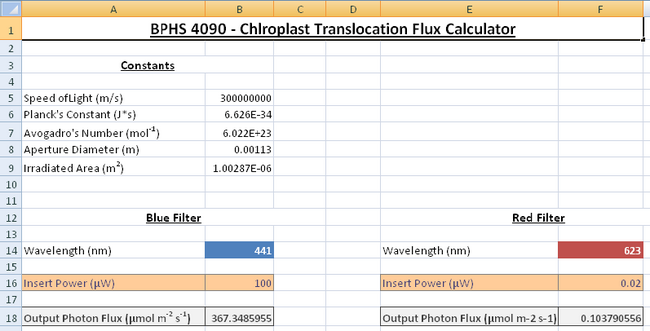
- With the blue filter in place turn on the radiometer, use the probe to measure the output power from the light source; this is done by removing the sample slide and placing the probe in the light path where the objective is. You may have to remove one of the eyepieces to get the probe in the light path, do this carefully and ensure you leave the x10 objective (labelled Fluor 10) in place, since this will be used for the light treatments. Ensure the probe is collecting all the light. You should measure a power reading in microwatts; enter this into the spreadsheet to get a photon flux as an output in units of μmol m-2 s-1 as shown in Figure 5.
- For the wavelength experiment a photon flux of around 200μmol m-2 s-1 is ideal to observe the effect of chloroplast translocation. Adjust the voltage dial knob on the microscope until you get a power reading which gives you a photon flux close to this value,once you do so, record your input power.
- Next place the cell sample back in the field of view, drop the neutral density filter labelled ND 2 in the light path to avoid pre-treating the cells with light. You’ll have to adjust the microscope again for Kohler Illumination, but it shouldn’t take much adjusting at this point.
- Move the microscope stage to capture as large of a cell population as possible, try to aim for 20 or more cells if possible by looking through the eyepiece as you move the stage.
- Ensure your cell sample is in good focus, you’re now ready to make a movie of chloroplast translocation.
- Making a Movie of Chloroplast Translocation:
- Turn on the CoolSnap CCD camera.
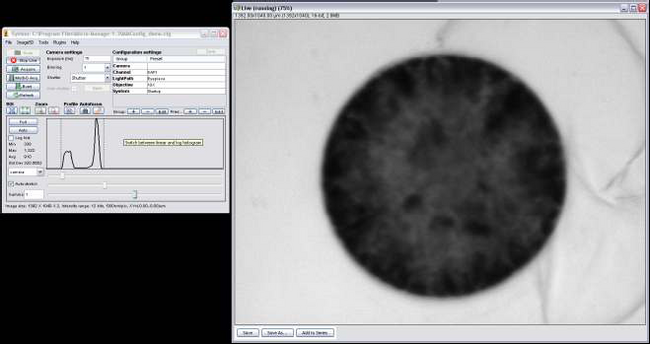
- Open MicroManager 1.3 by double clicking the icon on the desktop, you’ll notice the program ImageJ (Figure 6) opens as well, this will be used later for image processing. Figure 6 – MicroManager Software
- Click on Live Feed and turn the eyepiece mounting block about 45 degrees to the left, this allows light to pass through to the CCD camera and will project a live image onto the computer monitor.
- Next lift up the ND2 filter and adjust the exposure time, start by setting it to 1ms, you’ll also notice the cells on the screen are out of focus, use the fine focus adjustment until you get crisp edges along the periphery of the cell.
- Adjust the exposure until you get a live image that isn’t oversaturated (Figure 7).
- Due to the limited field of view, you’ll only be able to get about 1 cell in the live feed. Move the microscope stage slowly (since the response from the CCD is slightly delayed) until you get 1 cell in the field of view as shown in Figure 7.
- Click on “Multi-D acq.” Then set the number to 360 and interval to 10 seconds, and then hit acquire (Figure 8). This tells the program to take an image every 10 seconds; this will eventually give you a movie 60 minutes long, which should allow you to see some significant chloroplast translocation as shown in Figure 2.
- Once finished click on the save icon. Save your data in the directory C:\BPHS4090_Viridis_Systrophe, label your data by your name, date and title of work. This will create a file folder with all the images you acquired.
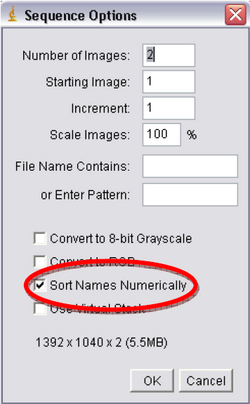
- Next you’ll be using ImageJ. Click “File->Import->Image Sequence”, double click on your file folder and select one of the images and press Open. Another window will open called “Sequence Options” (Figure 9), it will verify the number of images you have and open them as a stack, make sure the box titled “Sort Names Numerically” is checked and click Ok.
- This may take a little while, once all the images are loaded, use the mouse cursor icon to make a box around your cell and click on “Image->Crop”. Every image you imported will be cropped.
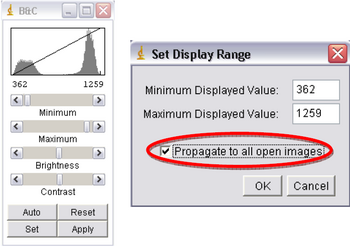
- Next click on “Image->Adjust->Brightness/Contrast”, another window called “B&C” will open; adjust the settings to ensure your images look the best they can. Once happy with the results click on Set, a new window will open, make sure the “Propagate to all open images” box is checked and click OK (Figure 10). This will adjust the brightness and contrast for every image in your imported stack.
- Once your image is adjusted for proper brightness and contrast select “File->Save as->AVI”, select a frame rate of about 10fps, this will make a movie 36 seconds long assuming you took 360 frames. A movie at this speed will dramatically show chloroplast translocation assuming the one cell you chose to view undergoes the effect. Save the AVI in the directory C:\BPHS4090_Viridis_Systrophe by your name, date and title of work.
- Copy your movie and the file called “Viridis_Systrophe_Spectrum.xls” onto a USB Key, this spreadsheet will be used for one of the questions. You can find the file in the desktop folder called “BPHS_4090_Viridis_Systrophe”.
- Look at your cell sample through the field of view and record how many cells are incipient systrophe and how many are complete systrophe using the criteria in Figure 2.
- Once this is done discard your cell sample slide in the bin labelled “Sharps”
- Next prepare a new sample slide and repeat the above procedure using the red filter labelled 623nm. DO NOT make a movie using the red filter; record the total number of cells in the field of view and illuminate the cells for an hour. After the light treatment record the number of incipient and complete systrophe. Be sure to adjust your power to get the desired photon flux of 200 μmol m-2 s-1 and ensure your microscope is set up for Kohler illumination.
|
Figure 3
|
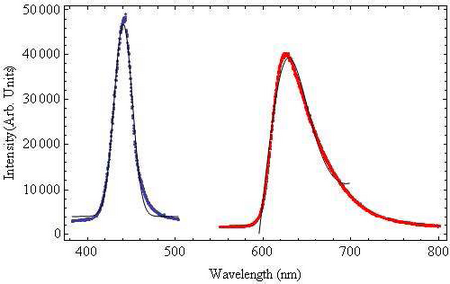
The wavelength dependence of light on chloroplast translocation will be investigated. From the absorption spectrum of chlorophyll shown in Figure 1, it is known the chlorophyll strongly absorbs both blue and red light, thus for the wavelength experiments we will be using blue and red filters band-pass filters, their transmissions are shown in Figure 4. The blue band-pass filter emits light at a peak wavelength of 441nm ± 10nm. The red filter is a band-pass filter with a tail at longer wavelengths. This filter has a peak wavelength of 623nm ± 45nm.
|
Figure 4: Emission Spectra of Band-pass Filters:The blue bandpass
filter was fit to a
Gaussian function and the
red band-pass filter was fit
to a Lorentzian Function to
account for the long tail
end. Both fit functions are
shown in black.
|
The cells will be illuminated with both blue and red light to determine the wavelength dependence of light on chloroplast translocation as described in the following outline:
|
Figure 5: The flux calculator has separate sections for the red and blue bandpass
filters. The cells will feel different energies corresponding to the different wavelengths of light
according to the Planck relationship E = hc/λ .
|
|
Figure 6: MicroManager Software.
|
|
Figure 7: MicroManager Live Feed.
|
|
Figure 8: Multi-Dimensional Acquisition.
|
|
Figure 9: Sequence Options.
|
|
Figure 10: Adjusting Image Brightness and Contrast.
|
Questions/Write-up
Answer the following questions in your lab notebook.
- An additional experiment was performed [8] by illuminating only half the cell at a time. The
results of this experiment are shown below:
Figure 11: Half Cell Illuminations: This particular cell was illuminated under broad band-pass irradiation with a photon flux of 1500μmol m-2 s-1. After an hour of irradiation, chloroplasts have vacated the illuminated area.
What can you conclude about these results? Is chloroplast translocation a protective mechanism for the cell or rather an avoidance mechanism? Explain in a few sentences.
- Imagine you had a source of UV light available and you wished to perform an additional experiment by illuminating the cells with UV light as you did earlier with the blue and red bandpass filters. Assume your UV light source emits at a peak wavelength of 250nm ± 10nm. Taking into account the absorption spectra of chlorophyll shown in Figure 1 and that DNA absorbs light at 260nm what would you expect to happen?
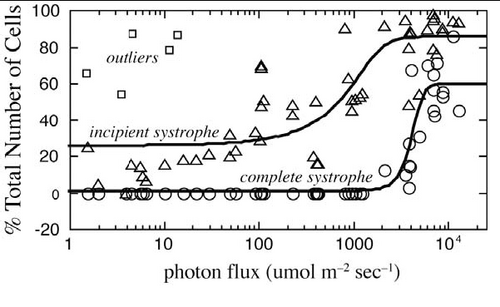
- During this lab we examined the wavelength dependence of light on systrophe, however other experiments [8] demonstrated there is also an intensity dependence as shown in the Figure below:
- Photosynthetic organisms use wavelengths between 400nm and 800nm for photosynthesis. From Figure 1, it can be seen that chlorophyll strongly absorbs blue and red light. Taking this into account and your answers to questions 1 and 2 what role do you think systrophe plays in photosynthesis? Are they related? Please discuss in a few sentences providing insights into your thinking process.
|
Figure 13: Intensity Dependence of Light on Incipient and Complete Systrophe.
|
At a photon flux of around 2000μmol m-2 s-1 there is a dramatic increase in the number of incipient systrophe. Remember incipient means the cells are in the process of undergoing chloroplast translocation. The photon flux we receive from the sun is around 2000μmol m-2 s-1. What does this imply?
For the formal write-up for this experiment, briefly describe the purpose of the experiment, the experimental set-up and the physics behind the biological process we’re observing, this will be your introduction. You should type up your results into a table comparing the illumination trials using red and blue filters. Provide a brief discussion interpreting your results. In addition you need to provide answers to the following questions.
- The effect of systrophe is thought to be a defence mechanism for the cell by decreasing the
absorptive cross sectional area of chloroplasts within the cell. We can test this hypothesis by
using a simple mathematical model to represent the cell. Assume each cell of E. viridis in its
resting state is a sphere with a shell of chloroplasts along the periphery of the cell. In reality
chloroplasts are also distributed radially along the cytoplasmic strands within the cell (analogous
to the spokes of a bicycle wheel); however for simplicity we will only consider the outer shell of
chloroplasts. After the cell undergoes systrophe, the chloroplasts surround the nucleus in a
thicker shell. In the table below some data are provided of cellular dimensions for 3 arbitrary
cells before and after systrophe using time lapsed images [8].
Table 1: Cellular Dimensions before and after Systrophe.
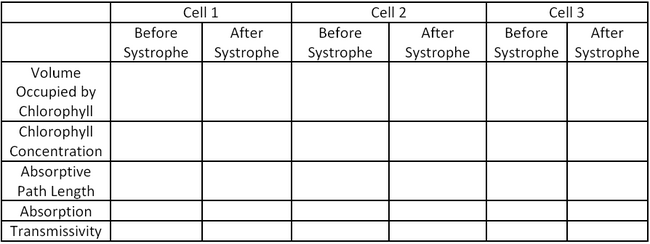
Cell 1 Cell 2 Cell 3 Cell Diameter (μm) 122.5 108.5 130.5 Systrophe Diameter (μm) 80.1 64.7 103.8 Nucleus Diameter (μm) 41.8 45.8 61.3 Thickness of Chloroplast Shell (Before Systrophe) (μm) 4.6 5.5 5.3 Use the data in Table 1 as well as the physical properties of the cells included in the introductions and the Beer-Lambert Law (Equation 1.3) to fill in the table below:
Where I is the transmitted intensity of light passing through the cell, Io is the initial intensity your light source, ε is the extinction coefficient of chlorophyll, C is the concentration of chlorophyll and l is path length which the light passes through.
Table 2: Absorptive Properties of Cells before and after Systrophe.
Based on your results in Table 2, does systrophe provide a protective mechanism for the cell by decreasing the absorptive cross sectional area? Why would an increase in absorption potentially be damaging for the cell? Consider both absorption and cross sectional area.
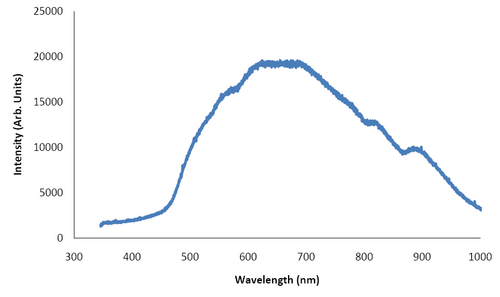
- Open the spreadsheet titled “Viridis_Systrophe_Spectrum.xls”; this is an emission spectra of the tungsten halogen bulb used for illuminating the cell. Calculate the total energy the cells would receive from the whole spectrum of light emitted from this source by normalization. You can use the spreadsheet to do your calculations and may wish to attach it to your lab report.
- Below is the emission spectrum from the tungsten halogen bulb used for illuminations. From the Planck Blackbody Distribution Law derive Wien’s Displacement Law which relates the colour temperature of a blackbody to the peak wavelength it emits at. If we treat tungsten as a blackbody, what is the color temperature associated with the peak wavelength observed in Figure 12? Does this make sense considering the melting point of tungsten is about 3350K? What correction do we need to take into account when deriving Wien’s Displacement Law from Planck’s Blackbody Distribution Law to account for the unusual high melting point implied from Figure 12?
- During systrophe chloroplasts are translated across the cell by molecular motors. It isn’t known
exactly which molecular motors are responsible for chloroplast translocation, however it should
be noted chloroplast translocation can be inhibited when cells of E. viridis are treated with 2,4 –
Dinitrophenol (DNP) [4]. The structure of DNP is shown in Figure 14.
Figure 14: Structure of 2,4 Dinitrophenol.
DNP acts as an uncoupling agent by disrupting the proton gradient the cell uses to create ATP. Any energy the cell would have gained from ATP production is lost as heat. ATP provides the energy for molecular motors to shuttle organelles across the cell. Based on the structure of DNP, taking into account hydrophilicity and hydrophobicity and any partial charges on the molecule explain how DNP inhibits chloroplast translocation. Does this provide any insight into the energy mechanisms involved during systrophe?
- ↑ http://biologywiki.apps01.yorku.ca/index.php?title=Main_Page/BIOL_4160/Determining_Excitation_and_Emission_Spectra
- ↑ Li, Z., Wakao, S., Fischer, B.B., Niyogi, K.K. 2009. Sensing and responding to excess light. Annual Review of Plant Biology 60: 239–260.
- ↑ Kasahara M., Kagawa, T., Oikawa, K., Suetsugu, N., Miyao, M., Wada, M. 2002. Chloroplast avoidance movement reduces photodamage in plants. Nature 420: 829–832
- ↑ Weidinger, M. 1980. The inhibition of systrophe by cytochalasin B. Protoplasma 102: 167–170.
- ↑ Weidinger, M. 1982. The inhibition of systrophe in different organisms. Protoplasma 110: 71– 74.
- ↑ Weidinger, M., Ruppel, H.G. 1985. Ca2+ requirement for a blue-light-induced chloroplast translocation in Eremosphaera viridis. Protoplasma 124: 184–187.
- ↑ Lawlor, D.W. 2001. Photosynthesis. Third edition. Springer-Verlag, New York. Chapters 3 and 4.
- ↑ Web-published: http://www.yorku.ca/planters/student_reports/viridis_systrophe.pdf (accessed 9 September 2010).
|
Figure 12: Tungsten Halogen Emission Spectrum.
|


