Difference between revisions of "Main Page/PHYS 3220/Viscosity"
| (21 intermediate revisions by 3 users not shown) | |||
| Line 8: | Line 8: | ||
<table width=400 align=center><td> | <table width=400 align=center><td> | ||
| − | <p align=justify>[[File:Vis- | + | <p align=justify>[[File:Vis-fig1v2.JPG|300px|border|center]] |
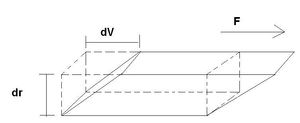
<b>Figure 1 -</b> Element of volume of a liquid in a tube. | <b>Figure 1 -</b> Element of volume of a liquid in a tube. | ||
<br clear=right> | <br clear=right> | ||
| Line 29: | Line 29: | ||
<table width=400 align=center><td> | <table width=400 align=center><td> | ||
| − | <p align=justify>[[File:Vis- | + | <p align=justify>[[File:Vis-fig2v2.JPG|300px|border|center]] |
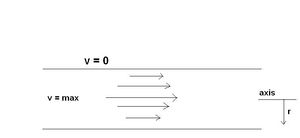
<b>Figure 2 -</b> Streamlined flow of a liquid in a tube. | <b>Figure 2 -</b> Streamlined flow of a liquid in a tube. | ||
<br clear=right> | <br clear=right> | ||
| Line 69: | Line 69: | ||
<table width=400 align=center><td> | <table width=400 align=center><td> | ||
| − | <p align=justify>[[File:Vis- | + | <p align=justify>[[File:Vis-fig3v2.JPG|300px|border|center]] |
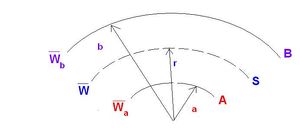
<b>Figure 3 -</b> Liquid between concentric cylinders. | <b>Figure 3 -</b> Liquid between concentric cylinders. | ||
<br clear=right> | <br clear=right> | ||
| Line 109: | Line 109: | ||
<h1>Method</h1> | <h1>Method</h1> | ||
| + | |||
| + | |||
<ol> | <ol> | ||
<li> <h2>Capillary tube.</h2> | <li> <h2>Capillary tube.</h2> | ||
| + | <h3>Apparatus</h3> | ||
| + | <ul><li>Capillary Tube</li> | ||
| + | <li>2 Beakers (600ml and 400 ml)</li> | ||
| + | <li>2 Bunsen Burner Stands</li> | ||
| + | <li>Stopwatch</li> | ||
| + | <li>Thermometer</li></ul> | ||
| + | |||
<p>For the determination of viscosity by use of a capillary tube we need to know the pressure p, this is given by </p> | <p>For the determination of viscosity by use of a capillary tube we need to know the pressure p, this is given by </p> | ||
<table width=400 align=center> | <table width=400 align=center> | ||
| Line 130: | Line 139: | ||
</p> | </p> | ||
</td><td> <b>(11)</b></td></tr></table> | </td><td> <b>(11)</b></td></tr></table> | ||
| − | <p>where A can be viewed as a correction factor, E< | + | <p>where A can be viewed as a correction factor, E<sub>a</sub> plays a role similar to activation energy in chemical reactions and R is the gas constant. Plot a graph of the obtained values and fit to (11). Hint: it is possible to turn (11) into a linear graph. </p> |
<p> Analyze the resulting fit with comments on the significance and the validity of the made assumption. </p> | <p> Analyze the resulting fit with comments on the significance and the validity of the made assumption. </p> | ||
</li> | </li> | ||
<li><h2>Concentric cylinder viscosimeter</h2> | <li><h2>Concentric cylinder viscosimeter</h2> | ||
| + | <h3>Apparatus</h3> | ||
| + | <ul><li>Vacuum Pump Oil</li> | ||
| + | <li>2 CENCO model 74235 Viscosity Measuring Instruments</li> | ||
| + | <li>Vernier Caliper</li> | ||
| + | <li>Meter Stick</li> | ||
| + | <li>Photo Gate Interface</li> | ||
| + | <li>2 Photo Gate Sensors</li> | ||
| + | <li>Oscilloscope</li> | ||
| + | <li>Mass</li> | ||
| + | <li>Thermometer</li> | ||
| + | <li>Heater (<i>Adjust-A-Volt</i>, STACO)</li></ul> | ||
| + | |||
<p>This instrument is used to find the viscosity of vacuum pump oil and to determine its variation with temperature. The inner drum in the viscosimeter is mounted on two bearings and is free to rotate under a torque, L, supplied by a mass, m, falling through a given height. The torque is given by L = mgk where k is the radius of the pulley around which the string supporting the falling mass m, is wound. If the mass falls a distance s, in time t, the angular velocity w is given by</p> | <p>This instrument is used to find the viscosity of vacuum pump oil and to determine its variation with temperature. The inner drum in the viscosimeter is mounted on two bearings and is free to rotate under a torque, L, supplied by a mass, m, falling through a given height. The torque is given by L = mgk where k is the radius of the pulley around which the string supporting the falling mass m, is wound. If the mass falls a distance s, in time t, the angular velocity w is given by</p> | ||
<table width=400 align=center> | <table width=400 align=center> | ||
| Line 159: | Line 180: | ||
</p> | </p> | ||
</td><td> <b>(15)</b></td></tr></table> | </td><td> <b>(15)</b></td></tr></table> | ||
| − | <p>To find the absolute value of η, | + | <p>To find the absolute value of η, use the spare viscosimeter (being careful not to damage the supporting bearings) and measure all pertinent dimensions. Fill the viscosimeter with oil until the level is about 1.5 cm above the lower surface of the inner cylinder. Measure the length l using a vernier caliper (notice that l is not simply the height of the oil level). Place the apparatus on the edge of the wall mount so that the suspended mass has an unrestricted fall of several feet.</p> |
<table width=300 align=center><td> | <table width=300 align=center><td> | ||
| − | <p align=justify>[[File:Vis- | + | <p align=justify>[[File:Vis-fig4v2.JPG|400px|border|center]] |
<b>Figure 4 -</b> Viscosimeter. | <b>Figure 4 -</b> Viscosimeter. | ||
<br clear=right> | <br clear=right> | ||
</p> | </p> | ||
</td></table> | </td></table> | ||
| − | <p>Record the time required for a mass m suspended from the string (wound around the pulley) to descend through a given distance. You will find that the downward velocity is not constant over the total drop but changes rapidly over the first few centimetres. It is therefore necessary to neglect the first few centimetres of drop, i.e., the stopwatch must be started once the descending mass is moving with constant velocity. Make several measurements of the time required to fall through a distance, s, and obtain an average time. Make a series of five determinations keeping the mass constant and increasing the effective length of the cylinder by adding liquid. The last observation should be made with the apparatus filled to the top of the inner cylinder.</p> | + | <p>Record the time required for a mass m suspended from the string (wound around the pulley) to descend through a given distance. You will find that the downward velocity is not constant over the total drop but changes rapidly over the first few centimetres. It is therefore necessary to neglect the first few centimetres of drop, i.e., the stopwatch must be started once the descending mass is moving with constant velocity. Make several measurements of the time required to fall through a distance, s, and obtain an average time using the photogates and oscilloscope setup described below. Make a series of five determinations keeping the mass constant and increasing the effective length of the cylinder by adding liquid. The last observation should be made with the apparatus filled to the top of the inner cylinder.</p> |
| − | <p> To collect the data, we can observe the transit of the masses through the two [[media:Visc_sensor.jpg|sensor gates]] on an [[media:Visc_scope.jpg|oscilloscope]]. With the oscilloscope | + | <p> To collect the data, we can observe the transit of the masses through the two [[media:Visc_sensor.jpg|sensor gates]] on an [[media:Visc_scope.jpg|oscilloscope]]. With the oscilloscope set for a long timebase, and the sensor box outputs attached to one channel, you will notice the abrupt signal change when anything passes through either sensor gate. You will need to use the "Run/Stop" button on the top right of oscilloscope to stop the trace from scrolling off the screen after the data is collected so you can measure or save the data. The scope can be used as a precise measuring tool for the time require for the mass to fall a particular distance.</p> |
<p>With the level of the liquid at the top of the inner cylinder, take a series of observations of time of descent vs. mass.</p> | <p>With the level of the liquid at the top of the inner cylinder, take a series of observations of time of descent vs. mass.</p> | ||
<p>To analyze your data, plot two graphs: one of the length '''l''' vs. time '''t''', and the other of the time, '''t''', vs. reciprocal mass'''1 /m'''. The first graph will give the value of the length correction '''e'''. The second graph should be a straight line of slope '''mt'''. '''η''' can then be obtained from Equation (12).</p> | <p>To analyze your data, plot two graphs: one of the length '''l''' vs. time '''t''', and the other of the time, '''t''', vs. reciprocal mass'''1 /m'''. The first graph will give the value of the length correction '''e'''. The second graph should be a straight line of slope '''mt'''. '''η''' can then be obtained from Equation (12).</p> | ||
| − | <p>To determine the variation of viscosity with temperature, repeat the above fixed mass measurement at several temperatures. Be sure to allow for expansion of the liquid when the temperature is increased. Compare the obtained results to the previous section.</p> | + | <p>To determine the variation of viscosity with temperature, repeat the above fixed mass measurement at several temperatures. Be sure to allow for expansion of the liquid when the temperature is increased. <b>(Do not adjust the heater setting above 60.)</b> Compare the obtained results to the previous section.</p> |
</ol> | </ol> | ||
<h1>Units</h1> | <h1>Units</h1> | ||
Latest revision as of 15:32, 26 September 2018
Contents
Viscosity
The purpose of this experiment is to determine the viscosity of a liquid and to find the variation of viscosity with temperature.
Theory
When a solid is subject to a shearing stress it deforms until the internal elastic forces of the solid exactly balance the external forces. Thus a finite force applied to a solid produces a finite deformation. If a similar force is applied to a liquid, however, the deformation increases indefinitely (the liquid flows). The flow can be imagined as the movement of adjacent layers over one another. The Newtonian friction caused by the relative motion between adjacent layers retards the flow and is called viscosity. This frictional force was assumed by Newton to be proportional to the velocity gradient perpendicular to the direction of the motion of the fluid, i.e., to dv/dr.
Consider an element of volume in a fluid as shown in the following diagram (ref. 1)
|
Figure 1 - Element of volume of a liquid in a tube.
|
The shearing stress on this element of volume is F/A where F is the force on the upper surface and A is the cross section. The shear is given by the ratio between the lateral displacement between the two surfaces to the separation between the surfaces. Thus, if we assume that the upper surface is moving with a velocity, dv, greater than that of the lower surface, the amount of shear occurring in unit time is dv/dr. The coefficient of viscosity or simply viscosity is defined as follows (for streamline motion).
| (1) |
The c.g.s. unit of viscosity is called the poise; it represents the viscosity of a substance that acquires a unit velocity gradient under the influence of a shearing stress of 1 dyne/cm2.
One method of measuring viscosity is to determine the flow of a liquid through a capillary tube. Let us consider how to measure viscosity in this way.
When a liquid flows through a narrow tube so that each particle moves parallel to the axis of the tube with constant velocity, the motion is said to be regular or streamlined. In this case, liquid in contact with the walls is at rest while the velocity is a maximum at the centre of the tube.
|
Figure 2 - Streamlined flow of a liquid in a tube.
|
We imagine the liquid as being divided up into a number of thin cylindrical shells, each shell sliding on the other. The viscous drag, f, per square cm. of one layer on the other is given by
| (2) |
For a cylinder of radius, a, length l, through which a liquid is flowing under a pressure differential, p, the total viscous drag balances the force due to the pressure difference.
| (3) |
Assuming that there is no radial flow the pressure is constant over any given cross-section. At r = a, v = 0, while at r = r, v = u, thus
| (4) |
The quantity of liquid, Q, flowing through the tube per second is given by Poiseuille's formula,
| (5) |
Thus, by measuring the quantity of liquid transferred through a capillary tube per unit time subject to a specific pressure difference, the viscosity of the liquid may be determined.
The viscosity may also be determined using the concentric cylinder viscosimeter. Consider a liquid between two concentric cylinders as illustrated in Figure 3.
|
Figure 3 - Liquid between concentric cylinders.
|
The outer cylinder is moving with angular velocity wB. If the liquid adheres to the walls of the cylinder, a shearing takes place in which concentric cylindrical layers of the liquid slip over each other with the angular velocity w increasing progressively from zero at the stationary cylinder to wB at the rotating one. Now, the rate of shear is given as
The quantity of liquid, Q, flowing through the tube per second is given by Poiseuille's formula,
| (6) |
Only the second term produces a viscosity effect, since a velocity gradient is needed to have relative slipping of layers and the associated friction. Thus,
| (7) |
If a torque L is applied to the rotating cylinder, (see Figure 3), the tangential force at the boundary SS' equals L/r and integration over r from A to B yields
| (8) |
Note that this formula is also valid if the inner cylinder is rotated with angular velocity wB while the outer cylinder is held stationary.
For cylinders closed at either end, equation (8) is modified to take into account the friction between the two ends of the cylinders according to
| (9) |
Method
-
Capillary tube.
Apparatus
- Capillary Tube
- 2 Beakers (600ml and 400 ml)
- 2 Bunsen Burner Stands
- Stopwatch
- Thermometer
For the determination of viscosity by use of a capillary tube we need to know the pressure p, this is given by
(10) where
- h = height of water column
- d = density of water
- g = acceleration due to gravity = 981 cm/sec2
The capillary tube is positioned at the bottom of a beaker, allowing for the monitoring of the water level. Using regular tap water, fill the beaker until the water starts going through the capillary tube. (Notice that the height of the water column is changing as water flows out, it is up to you to figure out a solution, consult your T.A. for ideas).
Measure the flow rate through the tube for various p values and calculate the viscosity. How does the result compare with the accepted viscosity value for water? Would you expect the same result if the capillary tube was slightly wider? Much wider? Comment on the reason for any potential discrepancies.
Record the water temperature. Repeat the measurements for at least two other temperatures. Assuming that the dependence resembles the “Arrhenius” equation
(11) where A can be viewed as a correction factor, Ea plays a role similar to activation energy in chemical reactions and R is the gas constant. Plot a graph of the obtained values and fit to (11). Hint: it is possible to turn (11) into a linear graph.
Analyze the resulting fit with comments on the significance and the validity of the made assumption.
Concentric cylinder viscosimeter
Apparatus
- Vacuum Pump Oil
- 2 CENCO model 74235 Viscosity Measuring Instruments
- Vernier Caliper
- Meter Stick
- Photo Gate Interface
- 2 Photo Gate Sensors
- Oscilloscope
- Mass
- Thermometer
- Heater (Adjust-A-Volt, STACO)
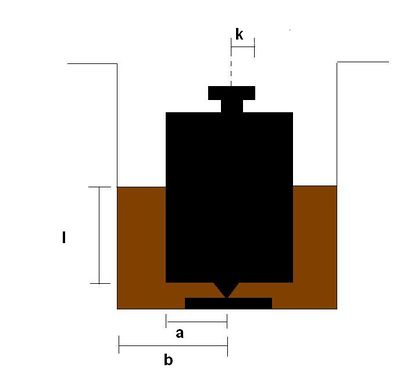
This instrument is used to find the viscosity of vacuum pump oil and to determine its variation with temperature. The inner drum in the viscosimeter is mounted on two bearings and is free to rotate under a torque, L, supplied by a mass, m, falling through a given height. The torque is given by L = mgk where k is the radius of the pulley around which the string supporting the falling mass m, is wound. If the mass falls a distance s, in time t, the angular velocity w is given by
(12) Therefore, Equation (9) becomes
(13) or
(14) where c is a constant
(15) To find the absolute value of η, use the spare viscosimeter (being careful not to damage the supporting bearings) and measure all pertinent dimensions. Fill the viscosimeter with oil until the level is about 1.5 cm above the lower surface of the inner cylinder. Measure the length l using a vernier caliper (notice that l is not simply the height of the oil level). Place the apparatus on the edge of the wall mount so that the suspended mass has an unrestricted fall of several feet.
Figure 4 - Viscosimeter.
Record the time required for a mass m suspended from the string (wound around the pulley) to descend through a given distance. You will find that the downward velocity is not constant over the total drop but changes rapidly over the first few centimetres. It is therefore necessary to neglect the first few centimetres of drop, i.e., the stopwatch must be started once the descending mass is moving with constant velocity. Make several measurements of the time required to fall through a distance, s, and obtain an average time using the photogates and oscilloscope setup described below. Make a series of five determinations keeping the mass constant and increasing the effective length of the cylinder by adding liquid. The last observation should be made with the apparatus filled to the top of the inner cylinder.
To collect the data, we can observe the transit of the masses through the two sensor gates on an oscilloscope. With the oscilloscope set for a long timebase, and the sensor box outputs attached to one channel, you will notice the abrupt signal change when anything passes through either sensor gate. You will need to use the "Run/Stop" button on the top right of oscilloscope to stop the trace from scrolling off the screen after the data is collected so you can measure or save the data. The scope can be used as a precise measuring tool for the time require for the mass to fall a particular distance.
With the level of the liquid at the top of the inner cylinder, take a series of observations of time of descent vs. mass.
To analyze your data, plot two graphs: one of the length l vs. time t, and the other of the time, t, vs. reciprocal mass1 /m. The first graph will give the value of the length correction e. The second graph should be a straight line of slope mt. η can then be obtained from Equation (12).
To determine the variation of viscosity with temperature, repeat the above fixed mass measurement at several temperatures. Be sure to allow for expansion of the liquid when the temperature is increased. (Do not adjust the heater setting above 60.) Compare the obtained results to the previous section.
Units
Give your results in both CGS and MKS units. The values of the viscosities are available from handbooks, and are usually quoted in centipoises (compare your results).
Questions and Discussion
Why does the moment of inertia of the rotating cylinder not enter the analysis of the problem? Discuss the sign of the length correction. Explain what the important sources of imprecision are, and elaborate on the importance of the constants e and c.
References
Any intermediate-level classical mechanics text, e.g.,
- K. Symon, Mechanics, 3rd ed., pp. 345 ff.
- R. Feynman, Leighton, Sands,Lectures on Physics, vol. II, chapter 41.


