Difference between revisions of "Main Page/PHYS 3220/Cavendish"
| (One intermediate revision by the same user not shown) | |||
| Line 79: | Line 79: | ||
<h1>Method</h1> | <h1>Method</h1> | ||
| − | <p><b>IMPORTANT: Treat the equipment gently. For example, slamming the door or bumping | + | <p><b>IMPORTANT: Treat the equipment gently. For example, slamming the door or bumping the apparatus will considerably lengthen the experimental observation time. </b></p> |
<p>In order for the balance to operate correctly, the torsion wire must be precisely vertical and must be able to move freely. The centres of the four balls must lie in one plane as well.(The balance is aligned and is ready for data collection.)</p> | <p>In order for the balance to operate correctly, the torsion wire must be precisely vertical and must be able to move freely. The centres of the four balls must lie in one plane as well.(The balance is aligned and is ready for data collection.)</p> | ||
<p> A computerized data collection method will be used in this experiment. The position of the laser beam can be monitored on the opposite wall. Rotate the large masses about 180 degrees so that they almost touch the case. You should make this adjustment carefully to ensure that the heavy balls do not knock the case. If the case is accidentally knocked, the mirror will be set into a large amplitude oscillation that will take about 1 hour to decay. You can therefore save yourself a lot of time (and effort) by making this adjustment delicately in the first place. </p> | <p> A computerized data collection method will be used in this experiment. The position of the laser beam can be monitored on the opposite wall. Rotate the large masses about 180 degrees so that they almost touch the case. You should make this adjustment carefully to ensure that the heavy balls do not knock the case. If the case is accidentally knocked, the mirror will be set into a large amplitude oscillation that will take about 1 hour to decay. You can therefore save yourself a lot of time (and effort) by making this adjustment delicately in the first place. </p> | ||
| Line 89: | Line 89: | ||
</p> | </p> | ||
</td></table> | </td></table> | ||
| − | <p>Carefully reverse the position of the heavy balls and repeat the procedure recording position vs. time and the new position at equilibrium x<sub>2</sub>. Now repeat this once more and obtain an average value for Δ. Find the separation of the centres of gravity of the two balls. What approximation(s) does this involve?</p> | + | <p>Carefully reverse the position of the heavy balls and repeat the procedure recording position vs. time and the new position at equilibrium x<sub>2</sub>. Now repeat this once more and obtain an average value for Δ. Find the separation of the centres of gravity of the two balls using your data and the apparatus parameters given in the table below. What approximation(s) does this involve?</p> |
| − | <p> | + | <p> Part of the laser beam is reflected onto a 128-segment linear photodiode array. The output of the photodiode array is monitored on an oscilloscope, and a computer connected to the oscilloscope downloads the data for processing. A control program written in Labview collects and processes the data, so you obtain data points which form a graph similar to what would be manually collected by observing the motion of the laser beam on the opposite wall.</p> |
<h1>Procedure</h1> | <h1>Procedure</h1> | ||
| Line 104: | Line 104: | ||
<ol> | <ol> | ||
<li>Run the program "Labview 2014", and open the vi called '''"Cavendish v2.vi"'''.</li> | <li>Run the program "Labview 2014", and open the vi called '''"Cavendish v2.vi"'''.</li> | ||
| − | <li>Click the white arrow located at the top left of the toolbar to start the program. When the program runs, it leads you through the steps of turning on the | + | <li>Click the white arrow located at the top left of the toolbar to start the program. When the program runs, it leads you through the steps of turning on the power supply, oscilloscope and laser. Follow the directions carefully, as the program needs to obtain a background light level with the laser off.</li> |
| − | <li>When prompted, turn on the oscilloscope and power supply only using the power buttons. The power supply should be giving +5V, and the settings should not be touched.</li> | + | <li>When prompted, turn on the oscilloscope and power supply only using the power buttons. The power supply should be giving +5V, and the settings should not be touched. Click OK in Labview.</li> |
| − | <li>To operate the laser, simply flip up the toggle switch of the laser power supply. The laser will appear a few seconds afterwards.</li> | + | <li>Next, you will be prompted to turn on the laser. To operate the laser, simply flip up the toggle switch of the laser power supply. The laser will appear a few seconds afterwards. CLick OK in Labview.</li> |
| + | <li>Data collection will begin and continue until the "STOP" button is pressed. | ||
| + | <li>When prompted enter a simple short file name (no spaces or characters). | ||
<li>The data will be saved in the folder "student data" located on the desktop as two lists of numbers - one is the centre pixel number, and the other is the time. You need to convert centre pixel number to a displacement in order to calculate G.</li> | <li>The data will be saved in the folder "student data" located on the desktop as two lists of numbers - one is the centre pixel number, and the other is the time. You need to convert centre pixel number to a displacement in order to calculate G.</li> | ||
| Line 130: | Line 132: | ||
<tr><td> Active area length</td><td> 10.2cm</td></tr> | <tr><td> Active area length</td><td> 10.2cm</td></tr> | ||
<tr><td> Pixel size</td><td> 0.8mm x 0.8mm</td></tr> | <tr><td> Pixel size</td><td> 0.8mm x 0.8mm</td></tr> | ||
| − | + | ||
</table> | </table> | ||
Latest revision as of 13:53, 11 August 2021
Contents
Measurement of the Gravitational Constant G with a Torsion Balance: The Cavendish Experiment
Learning Outcomes
- Rotational motion and torque
- Damped harmonic oscillations
- Error analysis
- Computational curve fitting
- Exposure to LabView
Introduction
Cavendish first performed the measurement of G, one of the classic experiments in physics, in 1798. Since then, there have been many attempts [1] to improve on this determination using variations of the same basic experiment. For example, see Gundlach[2] (2000) and Quinn[3] (2013). The apparatus at your disposal is a modified form of that used by Cavendish and others. The high sensitivity of the apparatus demands patience, perseverance and care from the experimenter. This is a very delicate instrument so treat it gently.
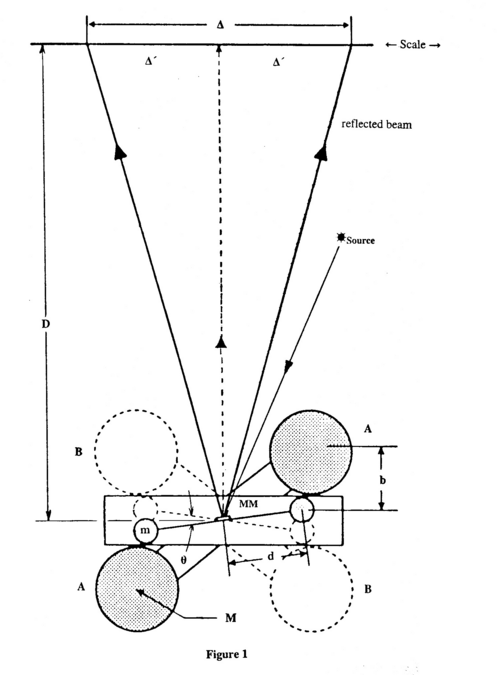
A laser, labelled Source in Fig. 1, illuminates a small (effectively) massless mirror MM that is attached to a light horizontal rod holding two small lead balls of mass m at a separation of 10cm. The small balls and mirror are suspended from a 35cm bronze torsion wire (perpendicular to the page in Fig. 1). The entire apparatus is enclosed in a rigid case that is mounted securely on a wall or table.
When two massive lead balls (each with mass M = 1.5kg) are placed asymmetrically as illustrated, in position AA, a small torque acts on the torsion balance twisting the torsion wire and causing the image of the light source to swing through a measurable distance Δ' along the opposite wall. The swing gradually decays until equilibrium is reached. The massive balls are next placed at diametrically opposite points, BB, for further measurement. After the oscillations have died away once more, a second equilibrium position is reached at a distance Δ' with respect to the other side of the zero position. We will use this pattern to evaluate a value for G, the gravitational constant.
|
Figure 1 - Experiment setup (Top View).
|
Theory
The torque generated by a force F acting on a mass m located at r is defined through the cross product T = r x F. For rotational motion in a plane described by an angle θ(t), angular velocity ω(t), and acceleration α(t) the torque has only a single non-zero component. It is perpendicular to the plane and is denoted by a scalar: T = Tz. The combination of the definition of torque with Newton's law of motion, and the moment of inertia I results in the equation of motion T = I α, where T represents the sum of all torques acting on the system (in our case two small masses rotating about their centre of mass). The external torque in our case is provided by the angular form of Hooke's law, as applicable for the torsion of wires, and we ignore for the moment the internal friction in the wire (which, however, is crucial to obtain a steady-state solution after long intervals).
If a torsion balance is twisted by a torque (couple) through a small angle θ (radians), the restoring torque is proportional to the angular displacement and is oppositely directed,
where C is the torque constant (cf. spring constant) of the wire. (What are the units of C?) We combine this with the equation of motion to obtain
| (1) |
Equation (1) is a homogeneous linear ordinary differential equation with constant coefficients. The friction responsible for the damping of the oscillations has been omitted here. Solve the equation and show that the period P is given by
| (2) |
Neglecting the material between the two small spheres, the moment of inertia I of the torsion balance about the axis of rotation is
| (3) |
where m is the mass of each ball and 2d is the distance between them.
Thus by measuring the period P and calculating I, the torque constant C may be found from equation (2). If Δ' is the deflection of the light beam from the rest position upon rotation of the torsion wire through θ radians, (Fig. 1) then
where D is the distance between the mirror and the recording medium.
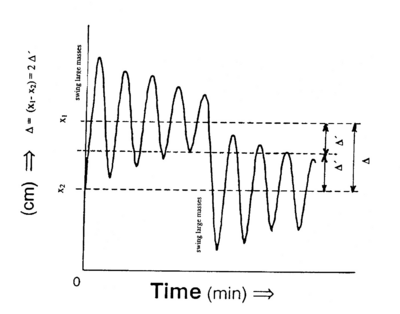
Once the large spheres are moved to their alternate asymmetrical position, the total deflection Δ produced (after the oscillations have died out) is (see Fig. 2)
| (4) |
The torque (couple) exerted by the large masses is
| (5) |
Here F is the magnitude of the gravitational force of attraction between the small and large masses, and is given by
where b is the distance between the centres of the small (m) and large (M) masses at equilibrium.
Method
IMPORTANT: Treat the equipment gently. For example, slamming the door or bumping the apparatus will considerably lengthen the experimental observation time.
In order for the balance to operate correctly, the torsion wire must be precisely vertical and must be able to move freely. The centres of the four balls must lie in one plane as well.(The balance is aligned and is ready for data collection.)
A computerized data collection method will be used in this experiment. The position of the laser beam can be monitored on the opposite wall. Rotate the large masses about 180 degrees so that they almost touch the case. You should make this adjustment carefully to ensure that the heavy balls do not knock the case. If the case is accidentally knocked, the mirror will be set into a large amplitude oscillation that will take about 1 hour to decay. You can therefore save yourself a lot of time (and effort) by making this adjustment delicately in the first place.
If this step has been completed successfully the position of the laser spot on the opposite wall will change slowly with time. The light spot will undergo damped oscillations about an equilibrium position Δ'. Determine the mean period of oscillation P from your plot of displacement vs. time. Allow about 45 min – 60 min for these oscillations to damp out and measure the new equilibrium position x1 (see Fig. 2).
|
Figure 2 - Graph of small-mass oscillations.
|
Carefully reverse the position of the heavy balls and repeat the procedure recording position vs. time and the new position at equilibrium x2. Now repeat this once more and obtain an average value for Δ. Find the separation of the centres of gravity of the two balls using your data and the apparatus parameters given in the table below. What approximation(s) does this involve?
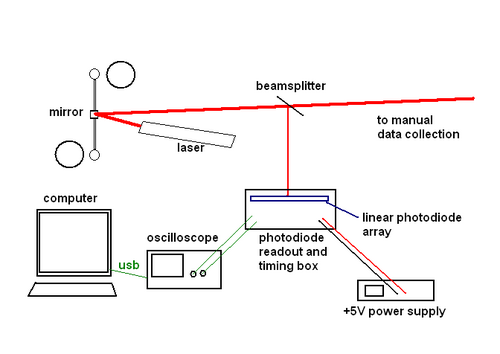
Part of the laser beam is reflected onto a 128-segment linear photodiode array. The output of the photodiode array is monitored on an oscilloscope, and a computer connected to the oscilloscope downloads the data for processing. A control program written in Labview collects and processes the data, so you obtain data points which form a graph similar to what would be manually collected by observing the motion of the laser beam on the opposite wall.
Procedure
|
Figure 3 - Experimental Setup.
|
Data Collection
- Run the program "Labview 2014", and open the vi called "Cavendish v2.vi".
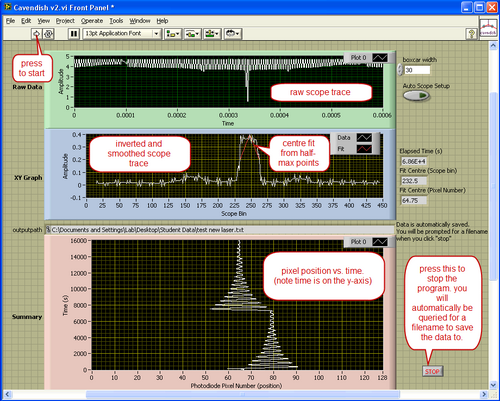
- Click the white arrow located at the top left of the toolbar to start the program. When the program runs, it leads you through the steps of turning on the power supply, oscilloscope and laser. Follow the directions carefully, as the program needs to obtain a background light level with the laser off.
- When prompted, turn on the oscilloscope and power supply only using the power buttons. The power supply should be giving +5V, and the settings should not be touched. Click OK in Labview.
- Next, you will be prompted to turn on the laser. To operate the laser, simply flip up the toggle switch of the laser power supply. The laser will appear a few seconds afterwards. CLick OK in Labview.
- Data collection will begin and continue until the "STOP" button is pressed.
- When prompted enter a simple short file name (no spaces or characters).
- The data will be saved in the folder "student data" located on the desktop as two lists of numbers - one is the centre pixel number, and the other is the time. You need to convert centre pixel number to a displacement in order to calculate G.
|
Figure 4 - The Labview control program.
|
Parameters of Apparatus
| Diameter of large spherical mass | 6.386 cm |
| Diameter of small spherical mass | n.a. |
| Mass of large spherical mass | 1500g |
| Mass of small spherical mass | 20g |
| Thickness of Cavendish box enclosure | 3.01cm |
| Separation between the centre of the mirror and the centre of the small spherical mass | 5.0cm |
| Details of the Photodiode Array | |
| Number of pixels | 128 |
| Active area length | 10.2cm |
| Pixel size | 0.8mm x 0.8mm |
Tasks
- Derive G from the above equations in terms of the period of oscillation.
- Discuss the effect of the attraction of the distant 1.5 kg sphere for the small balls.
- Enumerate and discuss other possible sources of error in the measurement of G using this apparatus.
- When the beam of light oscillates about its final position, it slowly damps out. Assume that the damping force is proportional to the (angular) velocity to find the equation of motion. From the data, find the damping constant. See textbook references on damped harmonic motion[4].
- Find the expression for the damping force at any time and compare the frequency of the motion without damping to that with damping. Comment on the difference(s) between the two.
- Why do you need to measure the period of oscillation?
- This experiment makes efficient use of real-time data acquisition and analysis. This is accomplished using the programming language LabView. What logical steps is the program following to convert what it downloads from the oscilloscope into a reasonable estimation of the photodiode pixel number which has been illuminated by the laser? You will need to look at the "block diagram" of the program. (You can inspect the block diagram while the program is running). You are only required to understand the general algorithm, not the details. You may find [5] a useful starting point for understanding LabView.
|
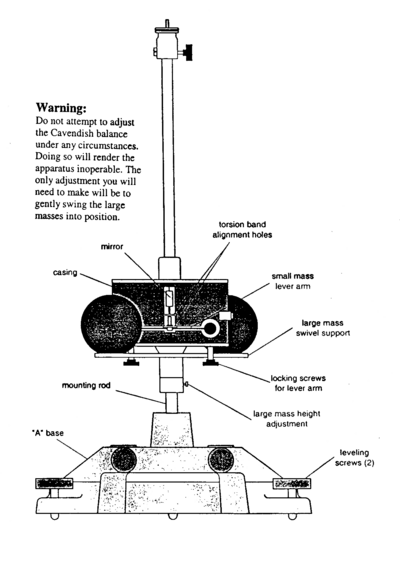
Figure 5 - Cavendish Beam Schematic.
|
|
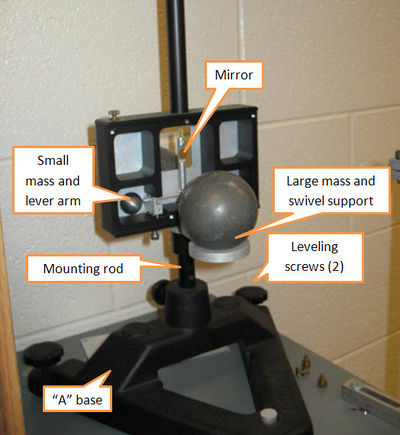
Figure 6 - Cavendish Beam.
|
References
- ↑ J.W. Beams, "Finding a Better Value for G", Physics Today, 24, 34 (1971)
- ↑ J.H. Gundlach & S.M. Merkowtiz, "Measurement of Newton's Constant Using a Torsion Balance with Angular Acceleration Feedback", Phys. Rev. Lett., 85, 2869 (2000)
- ↑ T. Quinn, H. Parks, C. Speake & R. Davis, "Improved Determination of G Using Two Methods", Phys. Rev. Lett., 111, 101102 (2013)
- ↑ For a discussion on damping see: A.P. French, Vibration and Waves, Norton, pp.62-70
- ↑ Getting Started with LabView
