Difference between revisions of "Main Page/PHYS 3220/Thermionic"
| (28 intermediate revisions by 3 users not shown) | |||
| Line 4: | Line 4: | ||
<h1> Theory </h1> | <h1> Theory </h1> | ||
| + | |||
| + | <h2>Part A</h2> | ||
<p>Consider a vacuum diode as shown in Fig. 1. The filament (usually a tungsten wire) is heated to a temperature in the vicinity of 2500<sup>o</sup> K. The electrons emitted by the filament (cathode) are drawn to the collector (anode) when the anode is raised to a high potential (0 to 400 Volts).</p> | <p>Consider a vacuum diode as shown in Fig. 1. The filament (usually a tungsten wire) is heated to a temperature in the vicinity of 2500<sup>o</sup> K. The electrons emitted by the filament (cathode) are drawn to the collector (anode) when the anode is raised to a high potential (0 to 400 Volts).</p> | ||
| Line 9: | Line 11: | ||
| − | <table width= | + | <table width=400 align=center><td> |
| − | <p align=justify>[[File:Th- | + | <p align=justify>[[File:Th-fig1v2.png|400px|border|center]] |
<b>Figure 1 </b> | <b>Figure 1 </b> | ||
</p> | </p> | ||
| − | </td> | + | </td></table> |
| − | <td><p align=justify>[[File:Th-fig2.png|450px|border|center]] | + | |
| + | <table width=400 align=center> | ||
| + | <td> | ||
| + | <p align=justify>[[File:Th-fig2.png|450px|border|center]] | ||
<b>Figure 2</b> | <b>Figure 2</b> | ||
<br clear=right> | <br clear=right> | ||
</p> | </p> | ||
| − | </td | + | </td></table> |
<p>From Fig. 2, note two distinct regimes of operation: a region (known as the space-charge limited region) where I<sub>a</sub> increases rapidly with V<sub>a</sub>; and the saturation region (known as the temperature limited region). At low anode voltages the cathode is surrounded by a dense space-charge of electrons, which are being continually emitted and reabsorbed. Only those electrons which are well away from the cathode are drawn towards the anode, since the electrostatic potential of the electron cloud counteracts the accelerating potential. A separate discussion of the current-voltage characteristic for this region follows below (eq. 2). As the anode voltage is increased, more electrons are drawn out of the space charge region toward the anode. For sufficiently high voltages the space-charge disappears and the beam current is limited by the rate of emission from the cathode, which leads to a saturation of the current. This saturation current depends on the temperature of the emitter and its work function, and is given by the Richardson-Dushman equation (cf.. ref. 1), </p> | <p>From Fig. 2, note two distinct regimes of operation: a region (known as the space-charge limited region) where I<sub>a</sub> increases rapidly with V<sub>a</sub>; and the saturation region (known as the temperature limited region). At low anode voltages the cathode is surrounded by a dense space-charge of electrons, which are being continually emitted and reabsorbed. Only those electrons which are well away from the cathode are drawn towards the anode, since the electrostatic potential of the electron cloud counteracts the accelerating potential. A separate discussion of the current-voltage characteristic for this region follows below (eq. 2). As the anode voltage is increased, more electrons are drawn out of the space charge region toward the anode. For sufficiently high voltages the space-charge disappears and the beam current is limited by the rate of emission from the cathode, which leads to a saturation of the current. This saturation current depends on the temperature of the emitter and its work function, and is given by the Richardson-Dushman equation (cf.. ref. 1), </p> | ||
| Line 41: | Line 46: | ||
<table width=400 align=center> | <table width=400 align=center> | ||
<td> | <td> | ||
| − | <p align=justify>[[File:Th-eqn1b.png|360px|center]] | + | <p align=justify>[[File:Th-eqn1b.png|300px|center]] |
| + | </p> | ||
| + | </td></table> | ||
| + | |||
| + | <p>where m and e are the electron mass and charge, and h is Planck's constant. This theoretical value of A should hold for a pure surface of a single crystal face. The Richardson-Dushman model as stated above oversimplifies the physical situation: e.g., one can introduce a quantum mechanical effect, i.e., the fact that electrons behave as waves and have a transmission and a reflection probability for leaving the surface (refs. 1-3). It is possible to use eq. (1) while treating ''A'' not as an absolute constant, but as a parameter that depends on the material and its crystal structure.</p> | ||
| + | |||
| + | <p>Within the space-charge-limited region one uses Poisson’s equation for the potential created by the electron cloud. The I-V characteristic is now given by the Child-Langmuir law. For a diode of cylindrical geometry this is, in MKSA units,</p> | ||
| + | |||
| + | <table width=400 align=center> | ||
| + | <tr><td> | ||
| + | <p align=justify>[[File:Th-eqn2.png|240px|center]] | ||
| + | </p> | ||
| + | </td><td> <b>(2)</b></td></tr></table> | ||
| + | |||
| + | <p>where r<sub>a</sub> is the radius of the anode, ε0 is the permittivity constant, β is a correction factor to account for the non-zero radius of the cathode. The GRD7 tube in use has a value β<sup>2</sup> = 1.1.</p> | ||
| + | |||
| + | <h2>Part B </h2> | ||
| + | |||
| + | <p>If a magnetic field of strength B is applied parallel to the axis of the diode, i.e. parallel to the filament, the electrons do not move in straight line paths directly to the anode. Their motion becomes complicated as they are accelerated by both the electric and magnetic fields, but from the motion of a charged particle in a magnetic field alone it is clear that the electron trajectories become more curved when B increases. Fig. 3 shows schematically some trajectories of electrons in the tube. Fig. 4 displays the anode current as a function of B; the current goes to zero when B reaches B<sub>crit</sub> , corresponding to trajectory (d) in Fig. 3. To obtain a relation between the parameters and B<sub>crit</sub>, we note that when an electron is at the anode (or just inside it), the electron must have kinetic energy equal to eV, where V is the anode voltage.</p> | ||
| + | |||
| + | <p>This simplified analysis assumes that the electrons acquire a velocity towards the anode due to the electric field. Subsequently the effect of the magnetic field is estimated to compare the gyration radius for a given B with the size of the anode in our configuration.</p> | ||
| + | |||
| + | |||
| + | |||
| + | <table width=600 align=center><tr><td> | ||
| + | <p align=justify>[[File:Th-fig3new.png|350px|border|center]] | ||
| + | <b>Figure 3-</b> Trajectory of electrons in a magnetic field pointed out of the page. | ||
| + | </p> | ||
| + | </td> | ||
| + | <td><p align=justify>[[File:Th-fig4.png|290px|border|center]] | ||
| + | <b>Figure 4- </b>B<sub>crit</sub> corresponds to trajectory ‘d’ | ||
| + | <br clear=right> | ||
| + | </p> | ||
| + | </td></tr> </table> | ||
| + | |||
| + | <p>If the electron follows a path that has a magnetic field controlled trajectory parallel to the anode, such as trajectory (d), it cannot be collected by the anode and no current can flow. Thus, we can relate the parameters as follows: when the electron's trajectories have a radius of curvature equal to half of the anode radius, the current stops, and the smallest B value at which this occurs is B<sub>crit</sub>. We can obtain the particle velocity v from its kinetic energy:</p> | ||
| + | |||
| + | <table width=400 align=center> | ||
| + | <td> | ||
| + | <p align=justify>[[File:Th-eqn2a.png|280px|center]] | ||
| + | </p> | ||
| + | </td></table> | ||
| + | |||
| + | <p>The magnetic field provides the centripetal force to keep it in orbit such that</p> | ||
| + | |||
| + | <table width=400 align=center> | ||
| + | <td> | ||
| + | <p align=justify>[[File:Th-eqn2bnew.png|360px|center]] | ||
| + | </p> | ||
| + | </td></table> | ||
| + | |||
| + | <table width=500 align=center> | ||
| + | <tr><td> | ||
| + | <p align=justify>[[File:Th-eqn3new.png|360px|center]] | ||
| + | </p> | ||
| + | </td><td> <b>(3)</b></td></tr></table> | ||
| + | |||
| + | <h1>Experiment </h1> | ||
| + | |||
| + | <p>The object of this experiment is to verify the three [(1), (2), (3)] expressions given above and thus understand the physical processes associated with the operation of the thermionic diode (Ferranti GRD7, shown in Fig. 5). The cathode is a tungsten filament in the form of a thin wire running along the axis of a surrounding cylindrical anode. The anode is divided into three sections. The two outer ones are called guard rings. They are maintained at the same potential as the central section and serve to reduce the fringing of the field within the central section. The necessary details of the diode are given below:</p> | ||
| + | |||
| + | <ul> | ||
| + | <li>Filament length, L = 1.45 cm</li> | ||
| + | <li>Filament radius, r<sub>c</sub> = 0.0065 cm</li> | ||
| + | <li>Anode radius, r<sub>a</sub> = 0.325 cm </li> | ||
| + | <li>anode length l<sub>a</sub> = 1.45 cm</li> | ||
| + | </ul> | ||
| + | |||
| + | <h2>Step 1</h2> | ||
| + | |||
| + | <p>Arrange the circuit as shown in the diagram Fig. 6. At fixed filament temperature, i.e. constant filament current (I<sub>f</sub>), the anode current (I<sub>a</sub>) is recorded for various accelerating potentials (V<sub>a</sub>) well into the saturation region. Repeat these observations for various filament temperatures. Check immediately whether you have enough data points in the space-charge limited region. The data should also span a wide range of accelerating voltages to cover the saturation regime!</p> | ||
| + | |||
| + | <p> | ||
| + | The filament temperatures are to be determined from the curve given in Fig. 7 that displays the temperature-filament current characteristic for the GRD7 diode. Use the optical pyrometer to confirm the temperature. Make sure to point the securely mounted pyrometer at the glowing filament, not it’s image that is visible on the anode. Understand how this instrument works and document this in your lab write-up. [[Media:PyrometerManual.pdf| Pyrometer Manual]] | ||
| + | </p> | ||
| + | |||
| + | <h2>Step 2</h2> | ||
| + | <p>Plot the anode current against the anode potential on a logarithmic scale: log Ia vs. log Va. Determine the slope for each curve (for each temperature) to check the power law. How consistent are these several slope determinations and how do they compare to the prediction given by equation (2)? Be sure to show on the graph where your slope is determined. Note that you should be in the space-charge-limited region.</p> | ||
| + | |||
| + | <p>Plot a graph of</p> | ||
| + | <table width=400 align=center> | ||
| + | <td> | ||
| + | <p align=justify>[[File:Th-eqn3b.png|100px|center]] | ||
| + | </p> | ||
| + | </td></table> | ||
| + | |||
| + | <p>and determine the slope (the saturation current I<sub>o</sub> is equal to the saturation current density J<sub>o</sub> x the surface area).</p> | ||
| + | |||
| + | <table width=600 align=center><tr><td> | ||
| + | <p align=justify>[[File:Th-fig5.png|300px|border|center]] | ||
| + | <b>Figure 5 </b> | ||
| + | </p> | ||
| + | </td> | ||
| + | <td><p align=justify>[[File:Th-fig6.png|380px|border|center]] | ||
| + | <b>Figure 6</b> | ||
| + | <br clear=right> | ||
| + | </p> | ||
| + | </td></tr> </table> | ||
| + | |||
| + | <p>How can the work function W be determined from this plot? Determine W for the emitter and compare your value with the literature value for tungsten (ref. 2). Determine the constant ''A''.</p> | ||
| + | |||
| + | <h2>Step 3</h2> | ||
| + | <p> Carefully remove the diode assembly from the upright holder and place it on the table. Place the given solenoid over the diode. Vary the current in the solenoid (this in turn varies the magnetic field B along the axis) to determine the cutoff field B<sub>crit</sub> for several values of the anode voltage V<sub>a</sub>. The magnetic field can be calculated from the solenoid current if one knows the number of windings per unit length (N) as B = μ I N, where μ is the permeability constant. Use the Gaussmeter to confirm your estimate of the magnetic field. Read up on how a Hall probe works and provide a brief explanation.</p> | ||
| + | |||
| + | <p>Plot B<sub>crit</sub><sup>2</sup> against V<sub>a</sub> to find the experimental relationship.</p> | ||
| + | |||
| + | <h1>References</h1> | ||
| + | <ol> | ||
| + | <li>S. Dushman, [http://rmp.aps.org/abstract/RMP/v2/i4/p381_1 Rev. Mod. Phys. '''2''', 381 (1930)].</li> | ||
| + | <li>Preston, Dietz, ''The Art of Experimental Physics'', 1st edition, pp. 143ff.</li> | ||
| + | <li>Harnwell-Livingwood, ''Experimental Atomic Physics'', pp. 189ff. </li> | ||
| + | </ol> | ||
| + | |||
| + | |||
| + | <h1>Appendix: Correction for the pyrometer reading. </h1> | ||
| + | <p>A pyrometer is a convenient means of measuring high temperatures, but it gives accurate reading <b>(only)</b> for a "black body"; our filament is not a black body, so a correction must be made. This is contained in the formula below relating the observed temperature to the true temperature, using the emissivity of the material.</p> | ||
| + | <table width=400 align=center> | ||
| + | <td> | ||
| + | <p align=justify>[[File:Th-eqn4.png|160px|center]] | ||
| + | </p> | ||
| + | </td></table> | ||
| + | |||
| + | <p>where</p> | ||
| + | <ul> | ||
| + | <li>T = true temperature in degree absolute</li> | ||
| + | <li>T<sub>obs</sub> = observed temperature in degree absolute</li> | ||
| + | <li>λ = 650 nm</li> | ||
| + | <li>E<sub>λ</sub> = 0.424, the spectral emissivity of Tungsten at λ = 650 nm</li> | ||
| + | <li>C<sub>2</sub> = 14.350 (second radiation constant) mm <sup>o</sup>K</li> | ||
| + | </ul> | ||
| + | |||
| + | <table width=400 align=left><td> | ||
| + | <p align=justify>[[File:Th-fig7.png|500px|border|center]] | ||
| + | <b>Figure 7</b> | ||
| + | <br clear=right> | ||
</p> | </p> | ||
</td></table> | </td></table> | ||
Latest revision as of 11:44, 15 September 2020
Contents
Thermionic Emission
It is well known that when a metal is heated to high temperatures it emits electrons, as in the case of the filament in an electron tube. This phenomenon of thermionic emission is called the Richardson Effect, and was discovered by Thomas Edison in 1883. It is explained by the electron theory of metals and is comparable to the evaporation of liquids. To obtain a thermionic current, both the emitter and the collector are placed in an evacuated vessel and an electric field is applied.
Theory
Part A
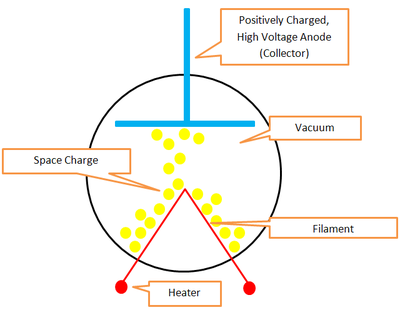
Consider a vacuum diode as shown in Fig. 1. The filament (usually a tungsten wire) is heated to a temperature in the vicinity of 2500o K. The electrons emitted by the filament (cathode) are drawn to the collector (anode) when the anode is raised to a high potential (0 to 400 Volts).
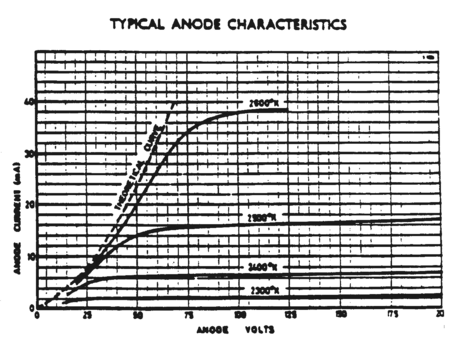
Typical current voltage characteristics Ia vs. Va for various values of filament temperature are shown in Fig. 2.
|
Figure 1 |
|
Figure 2
|
From Fig. 2, note two distinct regimes of operation: a region (known as the space-charge limited region) where Ia increases rapidly with Va; and the saturation region (known as the temperature limited region). At low anode voltages the cathode is surrounded by a dense space-charge of electrons, which are being continually emitted and reabsorbed. Only those electrons which are well away from the cathode are drawn towards the anode, since the electrostatic potential of the electron cloud counteracts the accelerating potential. A separate discussion of the current-voltage characteristic for this region follows below (eq. 2). As the anode voltage is increased, more electrons are drawn out of the space charge region toward the anode. For sufficiently high voltages the space-charge disappears and the beam current is limited by the rate of emission from the cathode, which leads to a saturation of the current. This saturation current depends on the temperature of the emitter and its work function, and is given by the Richardson-Dushman equation (cf.. ref. 1),
| (1) |
where :
- Jo = saturation current density
- A = a proportionality constant given below
- T = temperature of the emitter in K
- W = work function of the metal of the emitter
- k = Boltzmann constant
where m and e are the electron mass and charge, and h is Planck's constant. This theoretical value of A should hold for a pure surface of a single crystal face. The Richardson-Dushman model as stated above oversimplifies the physical situation: e.g., one can introduce a quantum mechanical effect, i.e., the fact that electrons behave as waves and have a transmission and a reflection probability for leaving the surface (refs. 1-3). It is possible to use eq. (1) while treating A not as an absolute constant, but as a parameter that depends on the material and its crystal structure.
Within the space-charge-limited region one uses Poisson’s equation for the potential created by the electron cloud. The I-V characteristic is now given by the Child-Langmuir law. For a diode of cylindrical geometry this is, in MKSA units,
| (2) |
where ra is the radius of the anode, ε0 is the permittivity constant, β is a correction factor to account for the non-zero radius of the cathode. The GRD7 tube in use has a value β2 = 1.1.
Part B
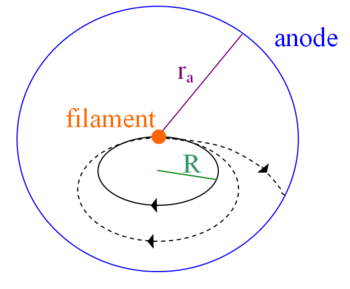
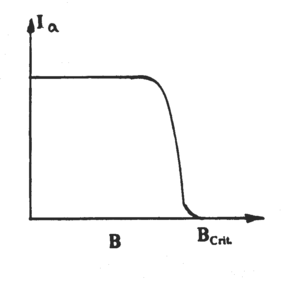
If a magnetic field of strength B is applied parallel to the axis of the diode, i.e. parallel to the filament, the electrons do not move in straight line paths directly to the anode. Their motion becomes complicated as they are accelerated by both the electric and magnetic fields, but from the motion of a charged particle in a magnetic field alone it is clear that the electron trajectories become more curved when B increases. Fig. 3 shows schematically some trajectories of electrons in the tube. Fig. 4 displays the anode current as a function of B; the current goes to zero when B reaches Bcrit , corresponding to trajectory (d) in Fig. 3. To obtain a relation between the parameters and Bcrit, we note that when an electron is at the anode (or just inside it), the electron must have kinetic energy equal to eV, where V is the anode voltage.
This simplified analysis assumes that the electrons acquire a velocity towards the anode due to the electric field. Subsequently the effect of the magnetic field is estimated to compare the gyration radius for a given B with the size of the anode in our configuration.
|
Figure 3- Trajectory of electrons in a magnetic field pointed out of the page. |
Figure 4- Bcrit corresponds to trajectory ‘d’
|
If the electron follows a path that has a magnetic field controlled trajectory parallel to the anode, such as trajectory (d), it cannot be collected by the anode and no current can flow. Thus, we can relate the parameters as follows: when the electron's trajectories have a radius of curvature equal to half of the anode radius, the current stops, and the smallest B value at which this occurs is Bcrit. We can obtain the particle velocity v from its kinetic energy:
The magnetic field provides the centripetal force to keep it in orbit such that
| (3) |
Experiment
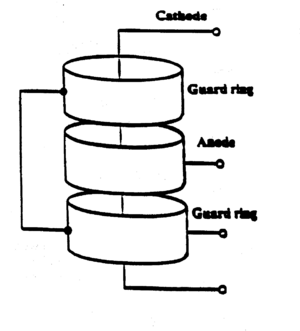
The object of this experiment is to verify the three [(1), (2), (3)] expressions given above and thus understand the physical processes associated with the operation of the thermionic diode (Ferranti GRD7, shown in Fig. 5). The cathode is a tungsten filament in the form of a thin wire running along the axis of a surrounding cylindrical anode. The anode is divided into three sections. The two outer ones are called guard rings. They are maintained at the same potential as the central section and serve to reduce the fringing of the field within the central section. The necessary details of the diode are given below:
- Filament length, L = 1.45 cm
- Filament radius, rc = 0.0065 cm
- Anode radius, ra = 0.325 cm
- anode length la = 1.45 cm
Step 1
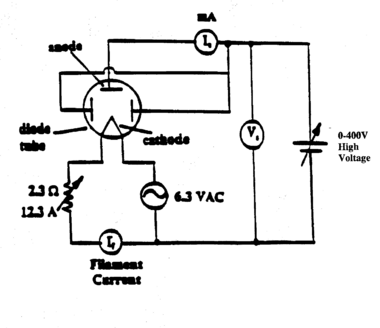
Arrange the circuit as shown in the diagram Fig. 6. At fixed filament temperature, i.e. constant filament current (If), the anode current (Ia) is recorded for various accelerating potentials (Va) well into the saturation region. Repeat these observations for various filament temperatures. Check immediately whether you have enough data points in the space-charge limited region. The data should also span a wide range of accelerating voltages to cover the saturation regime!
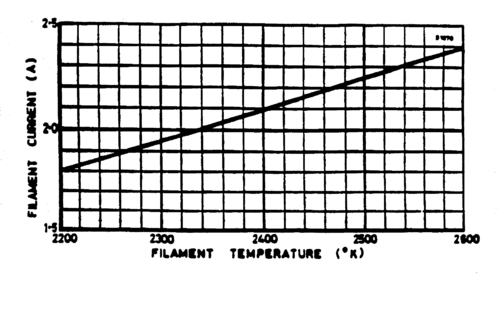
The filament temperatures are to be determined from the curve given in Fig. 7 that displays the temperature-filament current characteristic for the GRD7 diode. Use the optical pyrometer to confirm the temperature. Make sure to point the securely mounted pyrometer at the glowing filament, not it’s image that is visible on the anode. Understand how this instrument works and document this in your lab write-up. Pyrometer Manual
Step 2
Plot the anode current against the anode potential on a logarithmic scale: log Ia vs. log Va. Determine the slope for each curve (for each temperature) to check the power law. How consistent are these several slope determinations and how do they compare to the prediction given by equation (2)? Be sure to show on the graph where your slope is determined. Note that you should be in the space-charge-limited region.
Plot a graph of
and determine the slope (the saturation current Io is equal to the saturation current density Jo x the surface area).
|
Figure 5 |
Figure 6
|
How can the work function W be determined from this plot? Determine W for the emitter and compare your value with the literature value for tungsten (ref. 2). Determine the constant A.
Step 3
Carefully remove the diode assembly from the upright holder and place it on the table. Place the given solenoid over the diode. Vary the current in the solenoid (this in turn varies the magnetic field B along the axis) to determine the cutoff field Bcrit for several values of the anode voltage Va. The magnetic field can be calculated from the solenoid current if one knows the number of windings per unit length (N) as B = μ I N, where μ is the permeability constant. Use the Gaussmeter to confirm your estimate of the magnetic field. Read up on how a Hall probe works and provide a brief explanation.
Plot Bcrit2 against Va to find the experimental relationship.
References
- S. Dushman, Rev. Mod. Phys. 2, 381 (1930).
- Preston, Dietz, The Art of Experimental Physics, 1st edition, pp. 143ff.
- Harnwell-Livingwood, Experimental Atomic Physics, pp. 189ff.
Appendix: Correction for the pyrometer reading.
A pyrometer is a convenient means of measuring high temperatures, but it gives accurate reading (only) for a "black body"; our filament is not a black body, so a correction must be made. This is contained in the formula below relating the observed temperature to the true temperature, using the emissivity of the material.
where
- T = true temperature in degree absolute
- Tobs = observed temperature in degree absolute
- λ = 650 nm
- Eλ = 0.424, the spectral emissivity of Tungsten at λ = 650 nm
- C2 = 14.350 (second radiation constant) mm oK
|
Figure 7
|
