Difference between revisions of "Main Page/PHYS 4210/Bell's Inequalities"
| Line 132: | Line 132: | ||
<ol> | <ol> | ||
<li>Following the scheme described in Dehlinger and Mitchell <ref name="Dehlinger"/>, collect the data required to test a Bell's Inequality.</li> | <li>Following the scheme described in Dehlinger and Mitchell <ref name="Dehlinger"/>, collect the data required to test a Bell's Inequality.</li> | ||
| − | <li>''Note:'' If your coincidence count rate for the first set of angles in Table I of <ref name="Dehlinger"/> is not at least 300 cps, then you have not set up the experiment properly.</li> | + | <li>''Note:'' If your coincidence count rate for the first set of angles in Table I of <ref name="Dehlinger"/> is not at least 300 cps (though ideally 600+), then you have not set up the experiment properly.</li> |
<li>''Note:'' You must subtract off the background coincidence counts from each of your readings. (see <ref name="Dehlinger"/>).</li> | <li>''Note:'' You must subtract off the background coincidence counts from each of your readings. (see <ref name="Dehlinger"/>).</li> | ||
Revision as of 09:32, 20 March 2014
Contents
Bell's Inequalities and Quantum Entanglement
Deep at the root of the underlying principles of quantum mechanics lies shadowy principles based on probability which never sit well with some people. This experiment is meant to shine some (laser)light on these principles, and see if we can't come to some deeper understanding of the underlying framework of Quantum Dynamics.
No better introduction can be given than the following set of famous papers, commonly referred to today by their author lists.
Another useful resource, more directly relevant to our experiment and summarizing the information in the above papers is from Dehlinger and Mitchell [4].
It is imperative that you read and understand these papers before you attempt to perform this experiment.
Key Concepts
|
|
Method
All optical components have to be precisely aligned in order for your data to yield the expected results. Please take time to understand fully what is described below, and to diligently follow the directions.
Laser Safety goggles are provided, and are mandatory to be worn when the laser is on. THERE ARE NO EXCEPTIONS. If you are noticed not wearing the goggles, you will be forbidden from continuing.
Question: What is the relative sensitivity of the human eye to 405nm? Does this make it more or less dangerous?
|
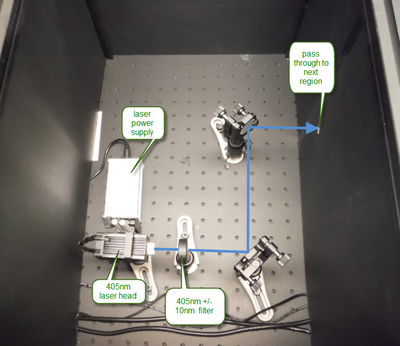
Figure 1 - Laser Region.
|
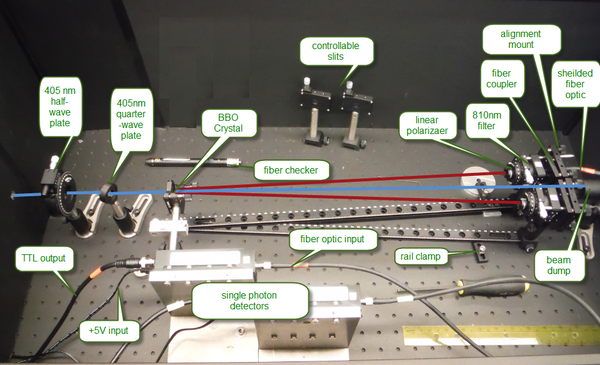
Figure 1 - Experiment setup.
|
Step 1: Align the laser and BBO crystal
- Remove the mounts containing the half-wave plate, quarter-wave plate and BBO crystal.
- Put on your safety goggles, and turn on the 405nm laser by plugging in the power supply. Using the two mirrors, adjust the path of the beam to follow at a constant height and consistently directly about one line of holes in the optics table.
- Insert the BBO crystal into position above the vertex of the rails. Adjust the mounting so the laser is passing through the crsytal without clipping. Fine adjust the angle of the crystal so the retro-reflected beam off of the face of the crystal is directly back onto the incoming beam.
- Shut off the laser.
Step 2: Align the 810nm-photon collection optics
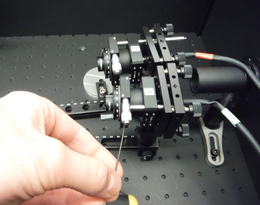
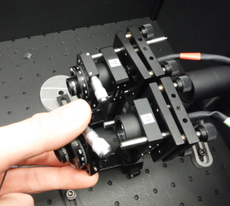
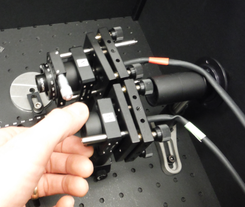
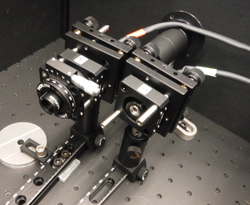
- For Detector Assembly A, remove the linear polarizer and unscrew the 810nm filter from the front of the photon collection optics.
- Adjust (if necessary) the height of the detector assembly to be the same height as the 405nm laser beam.
- Adjust the angle of rail containing the detector assembly to 3º.
- Remove the optical fiber attached to the single photon detector corresponding to that detector assembly. Attach the Fiber Checker to this free end of the optical fiber. This will send a beam of red light backwards through the system.
- Adjust the mount of the detector assembly so the red beam is aligned onto the back of the BBO crystal at the point where the 405nm passes through.
- The reflection of the red beam off of the back of the BBO crystal should reflect back into the other detector system. If not, your detectors are not symmetric about the 405nm beam path, or the BBO crystal pair is not perpendicular to the incoming 405nm beam.
- Replace the 810nm filter, linear polarizer, and fiber connection to the single photon detector.
- Repeat above for Detector Assembly B.
|
Figure 2a - Remove Linear Polarizer.
|
Figure 2b - Remove Linear Polarizer.
|
Figure 2c -Unscrew 810nm Filter.
|
Figure 2d -Filter and Polarizer Removed.
|
Step 3: Power up the Electronics
The single photon detectors are extremely sensitive pieces of equipment. Special care must be taken to minimize stray photons from entering and overloading the internal electronics.The overhead room lights must be turned off before the power supply for the single photon detectors are turned on. The acceptable ambient light sources are the desk lamp shining on the electronics rack, and a handheld red led keychain (particularly useful since your laser safety goggles transmit red light well.).
|
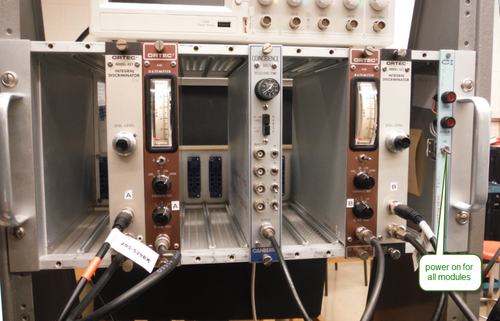
Figure 3 - Electronics Rack.
|
- Turn on the desk lamp so it shines onto the electronics rack.
- Turn the room lights off.
- Turn on the power to the electronics rack
- Turn on the power supply for the single photon counting modules. The voltage on this supply must be set greater than 5 volts. This is subsequently limited to precisely 5 volts by use of a voltage regulator downstream.
- Connect the outputs of each of the single photon counting modules to an Integral Discriminator. This device will look for an input signal greater than a user-set threshhold value and output a 1-microsecond-long TTL pulse. The discriminator value should be set to the lowest allowable setting.
- Connect the outputs of the Discriminators each to a ratemeter. The user manual for the ratemeter in the binder in the lab contains information on how to understand the integration time it used for various settings. This needs to be understood to properly compute the uncertainties. Observe and record the number of counts on each detectors (will be around 10,000 per second).
Step 4: Insert and align the half-wave and quarter-wave plates
- Insert the quarter-wave plate mount. Ensure the fast axis of the quarter-wave plate is vertical. The fine adjustment of the rotation will be done later.
- Disconnect from the output of the Discriminators from the Ratemeter and put them into the Coincidence unit. Have the output of the Coincidence unit go to one of the Ratemeters. Note how you can enable and disable the various input to the Coincidence unit. Does it give the expected output when only one channel is enabled?
- Insert the half-wave plate rotational mount. Ensure the 405nm beam is not clipping. The correct rotational setting of the half-wave plate is when the coincidence rates are equal when having the detector assembly linear polarizers both at 0º and both at 90º.
- Set both linear polarizers to 0º. Fine adjust the detectors assembly mounts to maximize this rate of the output from the Coincidence unit.
- Set the linear polarizers to 45º. Rotate the post of the quarter-wave plate so that the coincidence rate is a maximum.
Step 5: Fine Adjust
- Patiently cycle through adjusting the mounts of the detector assemblies, and the rail angle to maximize coincidence.
Step 5: Take Data!
- Following the scheme described in Dehlinger and Mitchell [4], collect the data required to test a Bell's Inequality.
- Note: If your coincidence count rate for the first set of angles in Table I of [4] is not at least 300 cps (though ideally 600+), then you have not set up the experiment properly.
- Note: You must subtract off the background coincidence counts from each of your readings. (see [4]).
Core Experiment
To setup the experiment as described in the Method section and to take one complete set of data required to test a Bell's Inequality as described in [4] using the readings from the ratemeter. A full analysis of the data with proper treatment of uncertainties is required.
You are required to complete the core experiment along with your choice of one of the modules listed below.
Module 1: Purity of Correlation
In this module, you will try to improve on the purity of the correlation by reducing the acceptance angle of the single-photon detectors by placing adjustable collimating slits into each path before the single photon detectors.
Module 2: Computer Analysis
In this module, you will use a Logic Analyzer to collect the raw outputs from the individual single photon detectors, then create an analysis program to calculate coincidence. Once this is accomplished, you can take data for longer periods of time, reduce the statistical uncertainty of the Bell's Inequality, and really put nail in the coffin of Hidden Variable Theories.
Module 3: Pump Laser Power
In this module, you will vary the power of the 405nm pump laser beam using neutral density filters in order to study the rate of coincident photon as a function of pump laser power. Does this trend follow expectations?
References
- ↑ A. Einstein, B. Podolsky & N. Rosen, "Can Quantum-Mechanical Description of Physical Reality Be Considered Complete?" Phys. Rev., 47, 777-780 (1935)
- ↑ J.S. Bell, "On the Einstein Podolsky Rosen Paradox" Physics, 1, 195 (1964)
- ↑ J.F. Clauser, M.A. Horne, A. Shimony, & R.A. Holt, "Proposed Experiment to Test Local Hidden-Variable Theories" Phys. Rev. Lett., 23, 880 (1969)
- ↑ 4.0 4.1 4.2 4.3 4.4 D. Dehlinger & M.W. Mitchell. "Entangled photons, nonlocality and Bell inequalities in the undergraduate laboratory." Am. J. Phys. 70, 903 (2002)
