Main Page/BPHS 4090/ElectroPhysiology of Chara revised
Contents
Overview
|
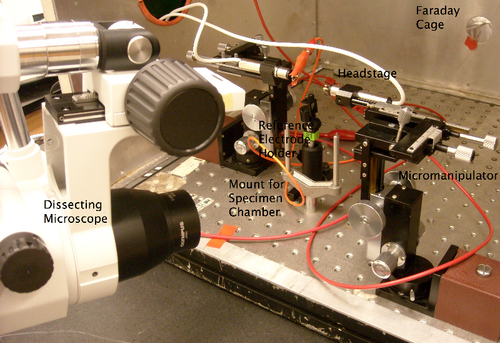
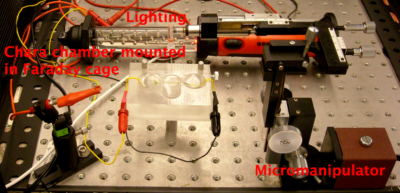
Workstation for Electrophysiology. The various components of the electrophysiology workstation are shown here and are described in the lab exercise. The Faraday cage shields the measuring apparatus from external electromagnetic noise. The micromanipulators, with xyz movement, are used to align the micropipette (mounted on the headstage), then descend to the cell to effect impalement, all viewed through the dissecting microscope. Note that the entire apparatus is mounted on an optical bench, to isolate the system from mechanical vibration.
|
|
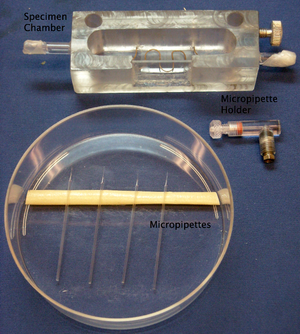
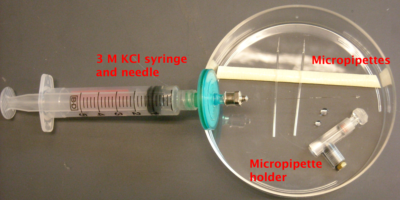
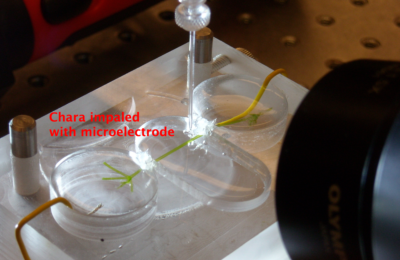
Specimen Chamber, Micropipette Holder and Micropipettes. The internodal cell is centered in the specimen chamber (filled with APW7) and gently held down by weights on either side of the observation window. Micropipettes should be filled with 3 M KCl as described in the lab exercise, inserted into the pre-filled (with 3 M KCl) micropipette holder and secured by tightening the knurled screw. See the lab exercise for details.
|
|
Example of Single and Dual Microelectrode Impalements into Chara australis. The cell was first impaled with one microelectrode, then impaled with two. Note that the voltage after two impalements eventually reached about -200 mV (not shown). The action potential has not been confirmed, but exhibits the characteristic duration and shape of an action potential in Chara.
|
Lab Exercise[1]: The Electrical Properties of Chara[2]
In this exercise, you will have the opportunity to measure the electrical properties of a single cell. The organism you will be using is a giant coenocytic (multi-nucleate) internodal cell of the green alga Chara australis. This is a common model cell for electrical measurements, and has been used extensively by biophysicists for more than 50 years. Its large size makes the challenges of intracellular recording simpler, allowing the researcher to focus on more sophisticated aspects of cell electrophysiology.
Objective
To measure the electrical properties of the plasma membrane of a cell: 1) Voltage measurement (single microelectrode impalement); and 2) Action potentials.
Introduction
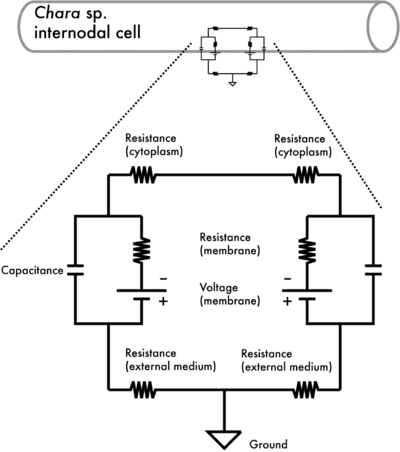
You are already aware of the electrical properties you will be measuring, at least in the context of electronics. In electrophysiology, electron flow is replaced by ion flow. The basic electrical parameters of the cell are shown in Figure 1.1.
|
Figure 1.1: Electrical circuit of an internodal cell of Chara. The diagram shows the electrical network of the plasma membrane (a capacitance, C, in parallel with a voltage, V, and resistance R.
Note that both the cytoplasm inside the cell and the external medium have an electrical resistance. This can complicate electrical measurements, but in your exercise, the resistance of the membrane is
much greater than cytoplasm and external medium resistances so their effect can be ignored. The electrical properties (V, I, C and R) are related through the basic equations: V = IR and I = C(dV/dt).
In this exercise, you will be measuring voltage, resistance and capacitance.
|
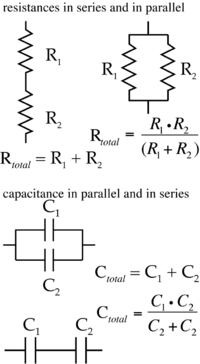
There are multiple resistive (and capacitative) elements in the circuit. A brief reminder of how resistances and capacitance in series and in parallel behave is shown in Figure 1.2.
|
Figure 1.2: Resistances and Capacitances The diagrams should remind you of the behaviour of resistance and capacitance when they are connected in series or in parallel. Both situations arise in the case of measurements of the electrical properties of biological cells (Fig. 1.1). Experimentally, resistance (Rtotal) can be measured by injecting a known current into the cell, the steady state voltage change is related to Rtotal by the equation V=IR. For biological cells, the standard units are (mV) = (nA)(MΩ). Capacitance is determined by measuring the voltage change over time while injecting a current pulse train into the cell. The shape of the voltage change is exponential, Vt=Vt=0• exp(–t/(RC)), eventually reaching steady state. If R is known, then C can be determined. The plasma membrane resistance and capacitance need to be normalized to the area of the cell membrane (area specific resistance: Ω cm2; specific capacitance per area: F cm–2). Note that the units match the behavior of resistances and capacitance in parallel. That is, a larger cell has greater membrane area. There is more ‘resistance in parallel’, and the total resistance (Ω) is lower. Conversely, a larger cell has a greater capacitance (F).
|
Of course, like all good things, resistive network analysis can be taken too far (Fig. 1.3).
| Figure 1.3: Resistive network analysis can be taken way too far. As shown in this cartoon from Randall Munroe (http://xkcd.com/356/) entitled “Nerd Sniping”. |
Methods
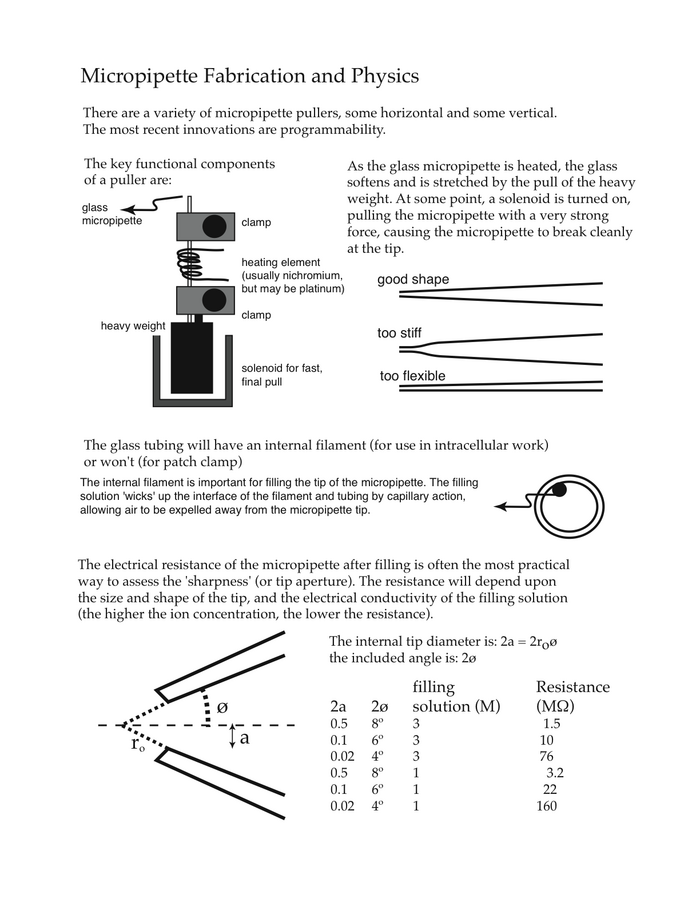
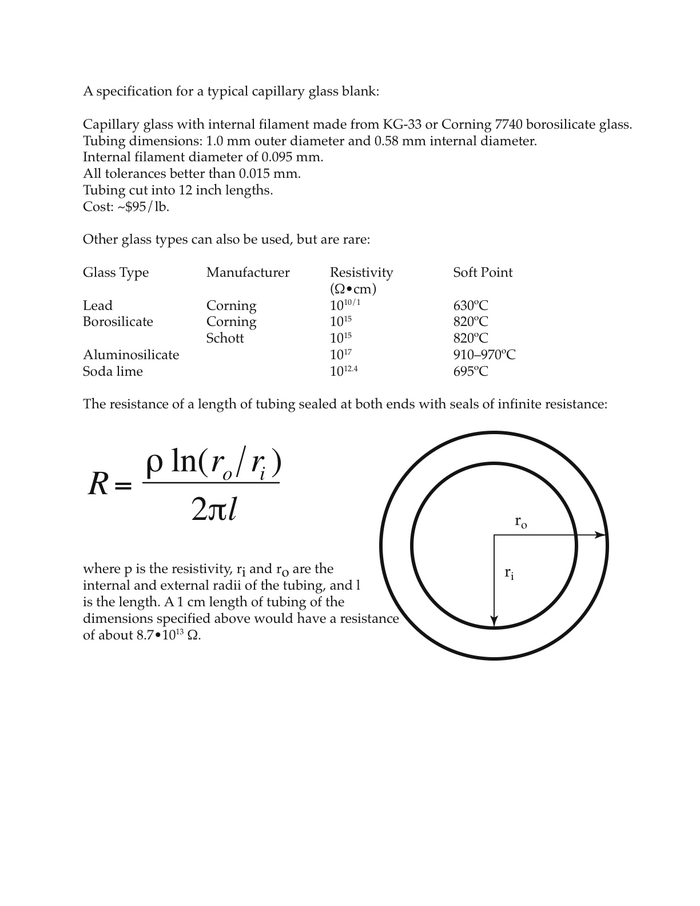
Microelectrode preparation and use. You will be provided with pre-pulled micropipettes. The micropipettes are made from borosilicate glass tubing, and pulled at one end to form a very fine and sharp tip. The dimensions at the tip are an outer diameter of about 1 micron (10-6 m), an internal diameter of about 0.5 micron. The micropipette contains a fine glass filament, bonded to the inner wall of the glass tube. This provides a conduit (via capillary action) for movement of the electrolyte filling solution right to the tip of the micropipette. A more detailed description of micropipette fabrication and physical properties is presented in Appendix I.
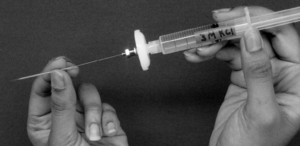
To fill the micropipette, insert the fine gauge needle at the back of the micropipette so that the needle tip is about 1 cm deep (Figure 1.4). Fill the back 1 cm of the glass tube with the solution (3 M KCl) and carefully place the micropipette on the support provided. Due to capillary action, the micropipette will fill all the way to the tip (sharp end) in about 3–5 minutes.
|
Figure 1.4: Microelectrode filling. The photo should give you an idea of how to fill the microelectrode. First, a small aliquot of 3 M KCl is placed at the back end of the micropipette. Capillary action will cause the KCl solution to fill the tip. Then, the micropipette is backfilled to ensure electrical connectivity.
|
While you are waiting for the tip to fill, you can fill the microelectrode holder with the same conductive solution (3 M KCl). After 3–5 minutes, re-insert the fine needle into micropipette, all the way to the shoulder (you should see the solution has filled to the shoulder due to capillary action). Fill the shank completely; avoid any bubbles in the glass tubing.
The micropipette tip is easily broken! Because of its small size, you may be unaware that it has been broken until you attempt to use it to impale the cell. If you touch, even lightly, the tip to any object, it will break. Having been warned, please exercise due care.
The micropipette is now ready to insert in the holder. Again, assure there are no bubbles in the holder or micropipette. Once inserted, tighten the cap to hold the micropipette firmly.
Reference electrode. The electrical network must be connected to ground. This is done using the so-called reference electrode. The half cell (Cl– + Ag <-------> AgCl + e–) is connected to the solution in the cell specimen holder by a salt-bridge (3 M KCl) immobilized in agar (2% w/v). By using 3 M KCl in the salt-bridge, the salt and half-cells are matched for the microelectrode and the reference electrode. You will be provided with a reference electrode pre-filled with 3 M KCl in agar. The reference electrode is stored in 3 M KCl, it is important to rinse off any residual KCl with the distilled H2O squeeze bottle. After the cell is placed in the chamber (see below), place the electrode in the holder next to the specimen chamber and adjust so that the tip is immersed. Connect the holder to the electrometer by connecting the silver wire at the back of the reference electrode to the ground on the electrometer.
Do not leave the reference electrode in air, so that it dries out. If it does dry out, electrical connectivity will be lost.
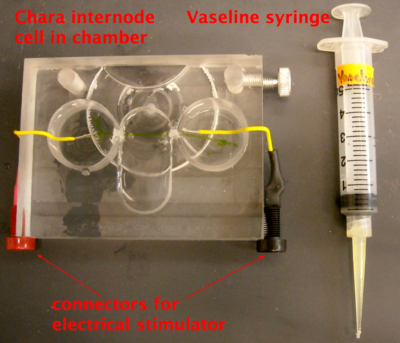
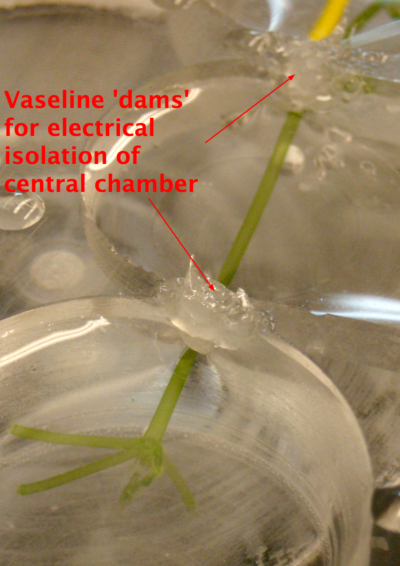
Cell preparation and use. The internodal cells of Chara australis will be provided for you stored in APW7 (artificial pond water, pH 7.0; APW7 contains the following (in mM): KCl (0.1), CaCl2 (0.1), MgCl2 (0.1), NaCl (0.5), MOPS buffer (1.0), pH adjusted to 7.0 with NaOH.). A single internode cell must be carefully placed in the cell specimen holder. The cell is laid across three chambers. The impalement and reference electrode are located in the central chamber. The two outer chambers are provided with metal leads to generate the voltage stimulus that triggers the action potential. The three chambers are electrically isolated from each other using petroleum jelly, in which the cell is embedded. Small weights will be provided to hold the cell in the specimen chamber, if required.
The cells must not be left in the air! They will be damaged. Furthermore, the cells must be handled gently. Don’t twist or deform them! Either stress (being left in the air or wounding during handling) will harm your ability to obtain good electrical measurements from the cell.
Ensure that the reference electrode is touching the solution (see above). If not, the circuit will be incomplete, resulting in wild swings in the measured voltage.
Insert the microelectrode holder into the headstage of the electrometer. By using the micromanipulator, you should be able to place the tip of the micropipette directly above the cell. It is sometimes easier to do this by eye, rather than using the dissecting microscope. Having positioned it, you are now ready to enter the APW7 solution. When the micropipette tip is in the APW7 solution, you will have a complete circuit. Use the test button on the electrometer to inject a 1 nA current through the micropipette. You should see a voltage deflection of about 1–2 mV, corresponding to a resistance of about 1–2 MΩ. If the tip resistance is very high (> 10 MΩ), it is likely that there is a high resistance somewhere else in your circuit. Common problems include the reference electrode and bubbles in the micropipette holder.
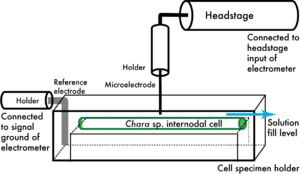
The completed set-up, ready for impalement, is shown in schematic form in Figure 1.5.
|
Figure 1.5: Impalement setup. The schematic should give you an idea of how the setup will look in preparation for impalement. Not shown are the positioning clamps for the reference electrode and micromanipulator for the microelectrode. For dual impalements, the second headstage-holder-microelectrode assembly is located to the left.
|
For measurements of cell potential alone (and action potentials), impalements with a single micropipette are all that is required. Aside: For measurements of cell resistance and capacitance, two impalements would have to be performed. The reason for this is that the micropipette tip resistance is similar in magnitude to the membrane resistance. So, it is difficult to separate out these two resistances in series. Furthermore, the tip resistance of the micropipette may change when the cell is impaled. The tip may ‘micro-break’, or cytoplasm may enter the tip; the first scenario will cause a lower resistance, the second will cause a higher resistance (why?). For these reasons, dual impalements are optimal.
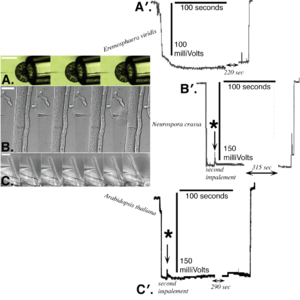
Cell impalement. Use the micromanipulator to bring the micropipette tip to the cell. When you (gently) press the tip against the cell wall, you may see a dimple in the wall. With additional movement of the tip against the wall, it will ‘pop’ into the cell. Your visual observation of impalement must be verified by a change in the microelectrode potential, from zero to a negative value (your can expect values of about –150 to –200 mV). Sometimes, the potential is initially about –100 mV, but then slowly becomes more negative.
|
Figure 1.6: Examples of Cell Impalements.
Photos of various cells are shown on the left (A is an algal cell, B is a fungi, C is a plant cell). Examples of the electrical changes that occur upon impalement of the cell (and upon removal of the microelectrode) are shown on the right. Electrical traces for impalement into Chara will be similar.
|
Protoplasmic streaming. Not explicitly a part of this lab exercise, protoplasmic streaming may be observable during your experiments. If it is, you may find it interesting to observe the rate and/or direction of the protoplasmic flow. Alternatively, you will be able to view protoplasmic streaming on the Nikon Optiphot microscope with a X10 objective by placing the internodal cell in a Petri dish containing APW7 solution (ensure the cell is immersed). To view protoplasmic streaming during electrical measurements, zoom the magnification on the dissection microscope head to its maximal level.
Action potentials.[3] Although action potentials may occur spontaneously, it is usually easier (and requires less patience) to induce them. A common method is to stimulate the cell with a large, transient voltage. The voltage is applied between the two outside chambers of the cell holder.
|
Micropipette etc. The micropipettes are filled as described previously.
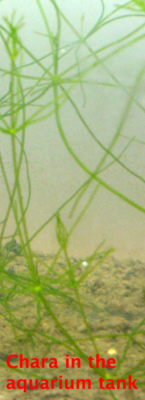
Chara in the tank. The Chara is carefully cut from plants in the aquarium by selecting straight internodes and
cutting the internode cells on either side of the one you selected.
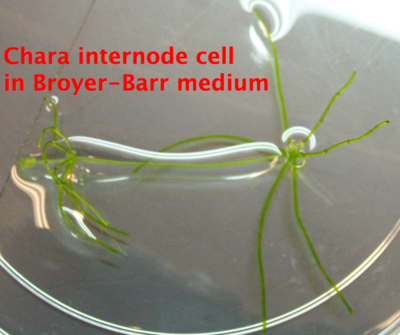
Chara in the dish. The internode cell is carefully (very gently) placed in a Petri dish filled with Broyar/Barr media (the nutrient solution used to grow Chara). Be warned that salt leakage from the cut internode cells can elevate potassium ion concentrations in the extracellular solution. This can cause depolarized potentials in subsequent measurements. Flushing the dish with fresh Broyer/Barr media should minimize this potential problem.
Chara in the chamber. The internode cell is carefully (very gently) placed in the chamber. The internode cell should fit in the two slots on either side of the central chamber. The slots are filled with vaseline to create an electrical barrier (see below). Note that the internode cell must be immersed in the media used for measurements.
Vaseline in the slots. The vaseline 'dams are shown in greater detail. Be gentle! Damage to the internode cell can make it quite difficult to measure action potentials.
Chara in the Faraday cage. The chamber can be mounted in the Faraday cage, as shown. Don't forget to connect the stimulator leads to the chamber.
Chara is impaled. Now, mount the microelectrode and impale the cell! Once impaled, the dissecting microscope should be zoomed to maximal magnification, so that you will be able to observe the cytoplasmic streaming.
|
Once you obtained a stable potential, you can stimulate the cell to induce an action potential. This is done by passing a large current between the two outer chambers using the pushbutton and 9 Volt battery. Press and release the button! Excessive, long-duration current will affect the cell, and obscure your ability to observe the action potential. Upon induction of an action potential, cytoplasmic streaming should cease. This is best documented by measuring the rate of cytoplasmic flow before you induce the action potential, versus after induction. Once an action potential has fired, the cell will enter a refractory period, so be patient if you want to stimulate the cell again. The refractory period will vary, but generally is several minutes.
Lab exercise write-up. The details of your write-up are in the hands of the lab coordinator/lecturer. Of especial interest would be the construction of equivalent circuits and their analysis. The schematic in Figure 1.1 is an excellent starting point. What is the effect of the resistance of the solution? Length of the cell (that is, cable properties)? Resistance of the cytoplasm? How do these affect your measurements? You can even test for the effect of the resistance of the APW solution, by placing the microelectrode —in solution— near and far away from the reference electrode.
Resistance and capacitance, when normalized to membrane area, are usually properties of the bilayer membrane, and therefore should be similar for all organisms. Electrical potentials are surprisingly variable, but almost invariably negative-inside. They depend in part upon the concentrations of permeant ions inside and outside of the cell (per calculations using the Goldman-Hodgkin-Katz equation), and on the presence/activity of electrogenic pumps. Chara australis is normally described as existing in either a “K-state” (the potassium conductance dominates, Em of about –150 mV) or a “pump-state” (where the H+ pump creates an electrogenic component, Em of about -200 mV).
Aside: Because of the additional challenges of performing dual impalements, it is advisable to practice single impalements first. Then, as you become more adept, take on the additional challenge of impaling the cell with two electrodes. The second impalement can be performed similarly, 1 to 2 cm from the first impalement. Resistance measurements. The electrode test button on the electrometer is limited to 1 nA (positive) currents. To obtain a more complete measurement of cell resistance, the ‘stimulus input’ on the electrometer is used. A command pulse with a magnitude and frequency that you select is connected to the stimulus input (Figure 1.6). To measure the capacitance, the pulse should be square (so that you can measure the rise time of the voltage deflection in response to the current injection. Be careful about the magnitude you select: high amperages will damage the cell, low amperages will result in very small voltage deflections. The resistance is calculated from the known current injection (measured at the current monitor output of the electrometer) and the steady state voltage deflection. Note that current is injected through one micropipette, while the voltage deflection is measured at the other micropipette. Multiple measurements are advised, as is using different current magnitudes, so that you can construct a current versus voltage graph. Capacitance measurements. Using the same current pulse protocol, you can determine the rise time of the voltage deflection. It’s possible to digitize the data and fit it to an exponential function. More commonly, the time required for the voltage to deflect 63% of the final steady state deflection is used. That time, commonly denoted the rise time τ, is equal to R•C (resistance times capacitance) simplifying the calculation greatly. Again, multiple measurements are advised. There is an important control: The resistance of the solution is fairly high due to the low concentration of ions. Thus, even when the microelectrodes are out of the cell, in solution, there will be a voltage deflection, smaller in magnitude than when the microelectrodes are impaled into the cell. To determine the resistance and the capacitance of the cell, the curves must be subtracted (curveimpaled — curveexternal).
The Natural History of Chara[4]
Although the experimental exercise is focused on direct measurements of the electrical properties of internodal cells of Chara, it seems very appropriate to introduce students to some of the Biophysical Explorations that have been done using Chara. It has been used for about 100 years, and will continue to be used for the foreseeable future.
Ecology
An algal species, Chara is a genus in the botanical family Characeae, which also includes another favorite model organism for biophysicists: Nitella. It is common in freshwater lakes and ponds in Ontario (McCombie and Wile, 1971)[5]. It tends to be found in water that is relatively nutrient-rich (but not excessively) based on measurements of the water conductivity (Chara grows well when the conductance is 220–300 µSiemens cm–2) and ‘transparent’ (non-turbid) based on Secchi disk measurements (a common technique for determining how far light travels through the water column, by lowering a marked disk into the water and determining the depth at which the markings are no longer visible) (Chara prefers transparencies of 2.5–6 m).
Evolution
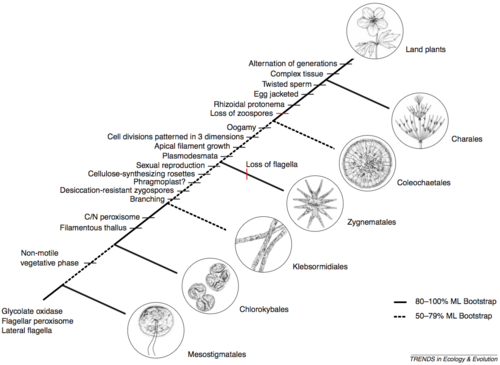
The family Characeae is part of an ‘order’ known as Charales, which in turn is part of an algal ‘meta-group’: Chlorophytes (Green Algae). The first fossils that bear strong resemblance to extant Charales are reported from the Silurian period, about 450 million years ago (McCourt et al., 2004). And in fact, much recent research using molecular phylogeny techniques that compare sequence similarities between extant species suggests that the Charales is the phylogenetic group from which land plants arose. A recent molecular reconstruction is shown in Figure 2.1, from McCourt et al. (2004)[6].
|
Figure 2.1: Molecular phylogenetic reconstruction of evolutionary divergences from which land plants evolved (McCourt et al., 2004)
The figure outlines relatedness based on the sequences of a number of genes. Associated characteristics/traits of each group are shown to the left. The traits are those known to occur in land plants. So, they serve as an alternative way to identify the evolution of groups that from which land plants eventually diverged.
|
Is this important? Basically, yes. The ‘invasion’ of land by biological organisms was a relatively late event in geological time. It opened the doors to a remarkable diversification of biological species, especially in the major phylogenetic groupings of insects (invertebrates), vertebrates and land plants (especially flowering plants). This was a time when Earth evolved into a form that would be somewhat familiar to us.
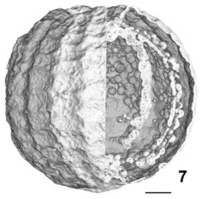
You may be surprised to learn that the discovery of Chara-like fossils and their identification relies upon the application of biophysical techniques in a very big way. To determine the structure of a fossilized organism is not easy. It’s rock, after all, and you can’t peel off the layers very easily. For this reason, Feist et al. (2005)[7] used “high resolution x-ray synchrotron microtomography”. The fossil samples were irradiated with the very bright monochromatic x-ray beam at the European Synchrotron Radiation Facility while being rotated. From the digital images captured as the sample was rotated, it was possible to reconstruct the three-dimensional internal structure of the fossil. One example of a reconstruction from their paper is shown in Figure 2.2.
|
Figure 2.2: An example of microtomography of a Charales fossil using a synchrotron x-ray light source (Feist et al., 2005)
The scale bar 150 µm. Thus very small structures can be observed. The value of synchrotron x-ray microtomography is to elucidate very clearly structures that can only be speculated about when looking at the surface of the fossil, or attempting to reconstruct the three-dimensional structure from thin sections cut with a fine diamond blade.
|
Membrane Permeability
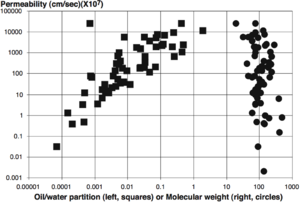
Moving to more recent times, our understanding the nature of the plasma membrane in biological cells relied upon measurements that were performed with Characean algae, primarily the work of Collander (1954)[8]. He determined the permeability of Nitella cells to a variety of solutes of varying molecular weight and hydrophobicity (as measured by partitioning between olive oil and water). Synopses of his results have been published extensively in textbooks ever since, because his results were most easily interpreted by proposing that the membrane was lipoidal in nature. We now know that the composition of membranes is mostly phospholipids. These create a bilayer structure with a hydrophobic interior and hydrophilic outer surface. Such a membrane structure naturally lends itself to the creation of an electrical element in cellular function, since the hydrophobic interior of the bilayer acts as an electric insulator.
Electrical Measurements
Electrical measurements have been performed on Characean internodal cells for probably 100 years. These measurements include action potentials, although due care should be exercised in nomenclature. Stimuli of various types do induce transient changes in the potential that are similar in nature to those induced in animal cells and are commonly described as action potentials. However, propagation of the electrical signal is not a consistent trait of action potentials in plants (including Chara). Figure 2.3 shows an example of action-potential-like responses in Nitella, from the work of Karl Umrath, who also explored the nature of propagated action potentials in the sensitive plant Mimosa.
|
Figure 2.3: An example of an electrical trace from the Characean alga Nitella (Umrath, 1933)[9]
I can’t offer any explanation of the trace, because the original paper is in German. The first transient upward (depolarizing?) peak (A) is reminiscent of an action potential. The second peak (B) looks like a voltage response to current injection.
|
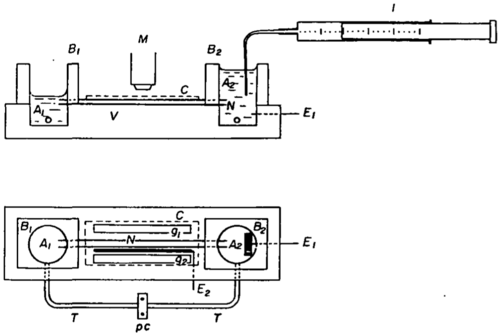
The scope of research that has explored the electrophysiology of Characean algae is immense. One important research theme was the nature of electrogenicity; that is, the cause of the highly negative inside potential of the internodal cell. The central role of an ATP-utilizing H+ pump was proposed from research using Characean algae (Kitasato, 1968[10]; Spanswick, 1972[11]), and extended to fungi and higher plants. The electrogenic H+ pump plays a role as central as that of the very similar Na+ K+ pump of animal cells. It is important for Biophysics students to be aware of the concept: Choose the right organism for a particular biological problem. In the case of the Characean algae, their large size made it possible to address the biological question of electrogenicity very directly. That is, the experimentalist could cut open the cell, remove the central vacuole, and then fill the cell with any desired solution. From such internal perfusion experiments, the ATP-dependence of electrogenicity was demonstrated directly (Shimmen and Tazawa, 1977[12]). An example of a perfusion setup is shown in Figure 2.4.
|
Figure 2.4: Internal perfusion of an internodal Chara cell (Tazawa and Kishimoto, 1968)[13] The cut ends are submersed in an artificial cell sap in the wells A and B. Not only can this technique be used for model organisms like Chara but also for animal cells of similar large size. Thus, internal perfusion was used to good advantage in initial studies of the action potential of the squid giant neuron, a system also used to unravel mechanisms of pH regulation.
|
Molecular Motors
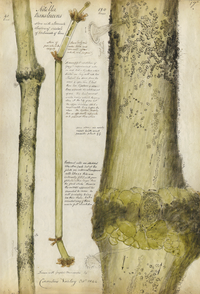
Protoplasmic streaming is something you should be able to observe during your experimental exercise. The first experiments on protoplasmic streaming in Chara date back to the early-1800’s, when Dutrochet performed surgical ligations of the internodal cells (op cit. Kamiya, 1986[14]). Kamiya (1986) describes the many other micromanipulations that were used to elucidate the biophysical properties of protoplasmic streaming (ligature experiments by Varley in 1844 are shown in the watercolor [right]). What makes this phenomenon even more fascinating is the unabated interest in protoplasmic streaming in Chara that continues to this day. On the one hand, it is now clear that Chara has the fastest known myosin molecular motor (this is the motive force for protoplasmic streaming) (Higashi-Fujime et al., 1995[15]; Higashi-Fujime and Nakamura, 2007[16]; Ito et al., 2009[17]). The molecular mechanism of the Chara myosin motor was studied by the optical tweezer technique: Kimura et al. (2003)[18] held an actin filament with dual optical tweezers (one at each end) and measured the force as the actin filament was displaced by the step-wise motion of the Chara myosin motor. One the other hand, protoplasmic streaming offers insight into the interplay between mass flow and diffusion in the context of micro-fluidics (Goldstein et al., 2008[19]), as measured by magnetic resonance velocimetry (van de Meent et al., 2009[20]).
Future Research
The continued use of Characean algae in biophysical research is certain. What research will be done? That depends upon the development of new technologies, and the pressing need to elucidate fundamental biological research problems. Braun et al. (2007)[21] describe some of the biological research problems that can be addressed using this “model system par excellence to study basic physiological and cell biological phenomenon in plants”. These include pattern formation, sensing of gravity and growth responses thereof, polarized growth, cytoskeleton dynamics, photosynthesis (especially coordinated metabolic pathways that involve multiple organelles), wound-healing, calcium signaling, and even sex determination. As to new technologies, the use of nmr imaging and even magnetic field measurements using a superconducting quantum interference device magnetometer (Baudenbacher et al., 2005[22]) suggest that as new technologies are developed, biophysicist will turn to Chara as a tried and true model system for validation of new techniques.
|
Identifying Chara to species often requires careful examination of the sexual organs. Thus, the list below may include species that in fact are not valid. Nevertheless, it serves as an indicator of the diversity present solely in this one, very famous, genus of the Chlorophyta | ||
Sources:
| ||
| Chara australis (corallina) | Chara halina A. García + | Chara pouzolsii J. Gay ex A. Braun + |
| Chara curtissii | Chara hispida Linneaus + | Chara preissii |
| Chara denudata Desvaux & Loiseaux + | Chara hookeri A. Braun + | Chara pulchella + |
| Chara drouetii | Chara hornemannii Wallman | Chara rudis (A. Braun) Leonhardi + |
| Chara dichopitys + | Chara horrida Wahlstedt + | Chara rusbyana M. Howe + |
| Chara eboliangensis S. Wang + | Chara huangii Y. H. Lu + | Chara sadleri F. Unger + |
| Chara ecklonii A. Braun ex Kützing + | Chara hydropytis + | Chara sejuncta A. Braun, 1845 |
| Chara elegans (A. Braun) Robinson | Chara imperfecta A. Braun + | Chara setosa Klein ex Willd. + |
| Chara excelsa Allen, 1882 | Chara intermedia A. Braun + | Chara spinescens Fée + |
| Chara fibrosa C. Agardh ex Bruzelius + | Chara leei S. Wang + | Chara stoechadum Sprengel + |
| Chara foetida | Chara leptopitys A. Braun + | Chara strigosa |
| Chara foliolosa | Chara longifolia | Chara stuartiana |
| Chara formosa Robinson, 1906 | Chara montagnei A. Braun + | Chara tomentosa Linneaus + |
| Chara fragilifera Durieu + | Chara muelleri | Chara vandalurensis |
| Chara fragilis Loiseleur-deslongchamps, 1810 | Chara muscosa J. Groves & Bullock-Webster + | Chara virgata Kützing + |
| Chara galioides De Candolle + | Chara palaeofragilis + | Chara visianii J. Blazencic & V. Randjelovic + |
| Chara globularis Thuiller + | Chara polyacantha | Chara vulgaris Linnaeus + |
| Chara gymnopitys | Chara polycarpica Delile + | Chara wallrothii Ruprecht + |
| Chara haitensis | Chara zeylanica Klein ex Willdenow + | |
|
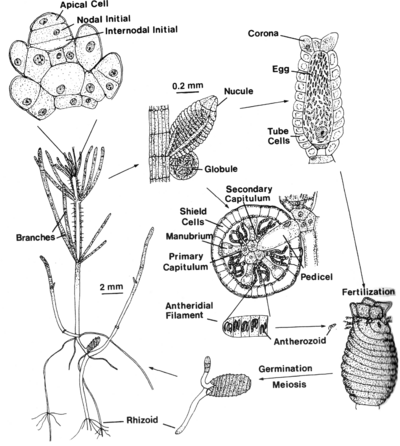
Chara Life Cycle Various structures of the Chara life cycle are shown (from Lee, 1980)[23]. The nucule is the female organ, the globule is the male organ. The eggs are fertilized by a motile sperm cell (antherozoid). The sperm cells swim with a twisting motion (almost a Drunkard’s walk) as they search for the egg cells. Once fertilized, the zygospore (diploid) may remain dormant for extended periods of time (up to 40 years based on recovery of germinating material from old lake sediments). Once released from dormancy (which requires light), the first division is meiotic, so that the vegetative structures are haploid. Rhizoids grow into the pond sediment. Once anchored, the filamentous internode and whorl cells grow upward towards the water surface. The internode cells are multinucleate.
|
|
Growth of Chara The montage is snapshots from a time lapse movie (starring Chara in the culture tank in your BPHS4090 teaching lab). The movie is available at http://www.yorku.ca/planters/movies.html#Chara. Detailed notes on culturing Chara are provided at the following BioWiki: http://biologywiki.apps01.yorku.ca/index.php?title=Main_Page/Culturing_Chara.
|
References
- ↑ By Roger R. Lew with assistance from Dr. Matthew George and Israel Spivak. 26 may 2011.
- ↑ I would like to acknowledge the advice and assistance of Professor Mary Bisson (University at Buffalo), who has researched the electrophysiology of Chara corallina for many years. Her advice and generous donation of Chara cultures made this lab exercise for York Biophysics students possible.
- ↑ Johnson BR, Wyttenbach, R.A., Wayne, R., and R. R. Hoy (2002) Action potentials in a giant algal cell: A comparative approach to mechanisms and evolution of excitability.The Journal of Undergraduate Neuroscience Education 1:A23-A27.
- ↑ Roger R. Lew, Professor of Biology, York University, Toronto Canada 10 july 2010
- ↑ McCombie, A.M. and I. Wile (1971) Ecology of aquatic vascular plants in southern Ontario impoundments. Weed Science 19:225–228.
- ↑ McCourt, R.M., Delwiche, C.F. and K.G. Karol (2004) Charophyte algae and land plant origins. TRENDS in Ecology and Evolution 19:661–666.
- ↑ Feist, M., Liu, J. and P. Tafforeau (2005) New insights into Paleozoic charophyte morphology and phylogeny. American Journal of Botany 92:1152–1160.
- ↑ Collander, R. (1954) The permeability of Nitella cells to non-electrolytes. Physiologia Plantarum 7:420–445.
- ↑ Umrath, K. (1933) Der erregungsvorgang bei Nitella mucronata. Protoplasma 17:258–300.
- ↑ Kitasato, H. (1968) The influence of H+ on the membrane potential and ion fluxes of Nitella. Journal of General Physiology. 52:60–87.
- ↑ Spanswick, R.M. (1972) Evidence for an electrogenic ion pump in Nitella translucens. I. The effects of pH, K+, Na+, light and temperature on the membrane potential and resistance. Biochimica et Biophysica Acta 288:73–89.
- ↑ Shimmen, T. and M. Tazawa (1977) Control of membrane potential and excitability of Chara cells with ATP and Mg2+.Journal of Membrane Biology 37:167–192.
- ↑ Tazawa M. and U. Kishimoto (1968) Cessation of cytoplasmic streaming of Chara internodes during action potential. Plant & Cell Physiology. 9:361–368
- ↑ Kamiya, N. (1986) Cytoplasmic streaming in giant algal cells: A historical survey of experimental approaches. Botanical Magazine (Tokyo) 99:441–467.
- ↑ Higashi-Fujime, S., Ishikawa, R., Iwasawa, H., Kagami, O., Kurimoto. E., Kohama, K. and T. Hozumi (1995) The fastest actin-based motor protein from the green algae, Chara, and its distinct mode of interaction with actin. FEBS Letters 375:151–154.
- ↑ Higashi-Fujime, S. and A. Nakamura (2007) Cell and molecular biology of the fastest myosins. International Review of Cell and Molecular Biology 276:301–347.
- ↑ Ito, K., Yamaguchi, Y., Yanase, K., Ichikawa, Y. and K. Yamamoto (2009) Unique charge distribution in surface loops confers high velocity on the fast motor protein Chara myosin.Proceedings of the National Academy of Sciences (USA) 106:21585–21590.
- ↑ Kimura, Y., Toyoshima, N., Hirakawa, N., Okamoto, K. and A. Ishijima (2003) A kinetic mechanism for the fast movement of Chara myosin. Journal of Molecular Biology 328:939–950.
- ↑ Goldstein, R.E., Tuval, I. and J-W van de Meent (2008) Microfluidics of cytoplasmic streaming and its implications for intracellular transport. Proceedings of the National Academy of Science, USA 105:3663–3667.
- ↑ Van de Meent, J-W., Sederman, A.J., Gladden, L.F. and R.E. Goldstein (2009) Measurement of cytoplasmic streaming in Chara corallina by magnetic resonance velocimetry.arXiv:0904.2707v1
- ↑ Braun M., Foissner, I., Luhring, H., Schubert H. and G. Theil (2007) Characean algae: Still a valid model system system to examine fundamental principles in plants. Progress in Botany 68:193–220.
- ↑ Baudenbacher F., Fong, L.E., Thiel G., Wacke, M., Jazbinsek V., Holzer, J.R., Stampfl, A. and Z. Trontelj (2005) Intracellular axial current in Chara corallina reflects the altered kinetics of ions in cytoplasm under the influence of light. Biophysical Journal 88:690–697.
- ↑ Lee, R.E. (1980) Phycology. Cambridge University Press. pp 441–445.
Appendix One: micropipette physics
Appendix Two: electrometer circuitry
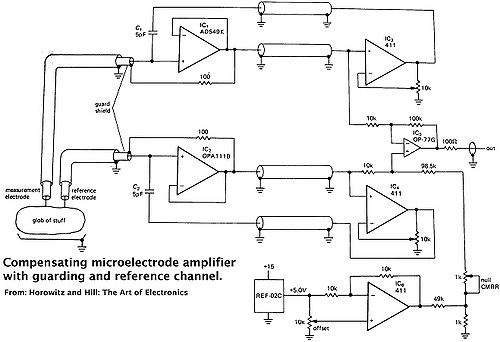
Although it is outside the scope of the lab exercise, it is often helpful to know what is happening ‘inside the box’. So, an example of an electrical schematic for an electrometer is shown below. The electronics are designed to work under high impedance conditions. That is, because of the high resistance of the microelectrode, the input impedance of the electrometer must be at least 103 higher (to avoid underestimating the voltage because of voltage dividing). Normally, the ‘heart’ of the electrometer is the electrical circuitry in the headstage of the electrometer. This is where the low noise voltage follower is housed, as near as possible to the cell being measured to minimize the extent of electrical noise pick-up. The headstage is connected to the electrometer with a shielded cable. Thus, in a ‘normal electrometer’, the circuitry shown below is housed in two separate enclosures.
|
Figure 4.1: Electrical schematic of a typical high input impedance electrometer. This example is not completely equivalent to the circuit in the electrometers you will be using. It is a simplified circuit from a book by Paul Horowitz and Winfield Hill (1989) The Art of Electronics. Cambridge University Press. pp. 1013–1015. Low-noise FET (field effect transistor) operational amplifiers (IC1 and IC2) that have low input current noise (to minimize voltage offsets caused by the high resistance of the cell (>106 Ohms) and input impedance of the electrometer (>1011 Ohm). The two operational amplifiers are configured as an instrumentation amplifier, in which the voltage is measured as the difference between cell voltage and ground. This is a very effective way to remove extraneous electrical noise from the measurement, known as common mode rejection (CMR). The FETs are usually carefully paired to match voltage drift. The rest of the circuit includes active compensation of capacitance and a reference voltage to provide greater measurement accuracy.
|
To further minimize the problem of electrical noise pick-up because of the high impedance of the microelectrode, it is normal to ‘shield’ the cell specimen holder from electromagnetic noise (fluorescent lamps and computer monitors are common sources of electrical noise). The shield —usually an enclosing grounded box of conductive metal— is called a Faraday cage. You should be able to observe the problem of extraneous noise yourself. With the microelectrode and reference electrodes in place, stick your finger near the cell specimen chamber while pointing your other arm at the overhead fluorescent lamps. You should see the appearance of noise on the DC output of the electrometer, probably in the frequency range of 60 Hz.
Appendix Three: APW (artificial pond water) Make-Up
Make-Up of APW (artificial pond water)
Artificial pond water (APW) is used to mimic the concentrations of major ions normally found in freshwater environments, where algae typically grow. The APW stocks are stored as X100 concentrated solutions in a refrigerator. When diluted to final concentration, the pH is adjusted to the appropriate level with NaOH. APW 5 is adjusted to pH 5.0, APW 6 is adjusted to pH 6.0, etc.
X100 stocks are made-up as 100 mM final:
| Salts | Molecular Weight | grams/100 ml |
| Potassium chloride (KCl) | 74.56 | 0.746 |
| Calcium chloride, dihydrate (CaCl2 2H2O) | 147.02 | 1.470 |
| Magnesium chloride, hexahydrate (MgCl2 6H2O) | 203.31 | 2.033 |
| Sodium chloride (NaCl) | 58.44 | 0.584 |
| Sodium sulfate (Na2SO4) (for APW10) | 142.04 | 1.420 |
| Buffers | ||
| MES (pKa 6.15) | 195.23 | 1.952 |
| MOPS (pKa 7.20) | 209.26 | 2.092 |
| TES (pKa 7.50) | 229.25 | 2.293 |
| TAPS (pKa 8.40) | 243.20 | 2.432 |
| CAPS (pKa 10.40) | 221.32 | 2.213 |
For final solutions (final volume 1 liter)
| 100 mM Stock | KCl | CaCl2 | MgCl2 | NaCl | Buffer |
| (in ml/1000 ml) | |||||
| APW 5 | 0.1 | 0.1 | 0.1 | 0.5 | 1.0 MES |
| APW 6 | 0.1 | 0.1 | 0.1 | 0.5 | 1.0 MES |
| APW 7 | 0.1 | 0.1 | 0.1 | 0.5 | 1.0 MOPS |
| APW 8 | 0.1 | 0.1 | 0.1 | 0.5 | 1.0 TES |
| APW 9 | 0.1 | 0.1 | 0.1 | 0.5 | 1.0 TAPS |
| APW 10 | 0.1 | 0.1 | 0.1 | 0.5 | 1.0 CAPS plus 0.05 Na2SO4 |
pH is adjusted to final value with NaOH (1 N)
Source: Spanswick RM (1972) Evidence for an electrogenic ion pump in Nitella translucens. I. The effects of pH, K+, Na+, light and temperature on the membrane potential and resistence. Biochimica Biophysica Acta 288:74-89
